
Data Sync Job Operations
Learn how to efficiently manage Data Sync job operations. This comprehensive guide covers job lifecycle management, monitoring, and best practices for optimal performance.
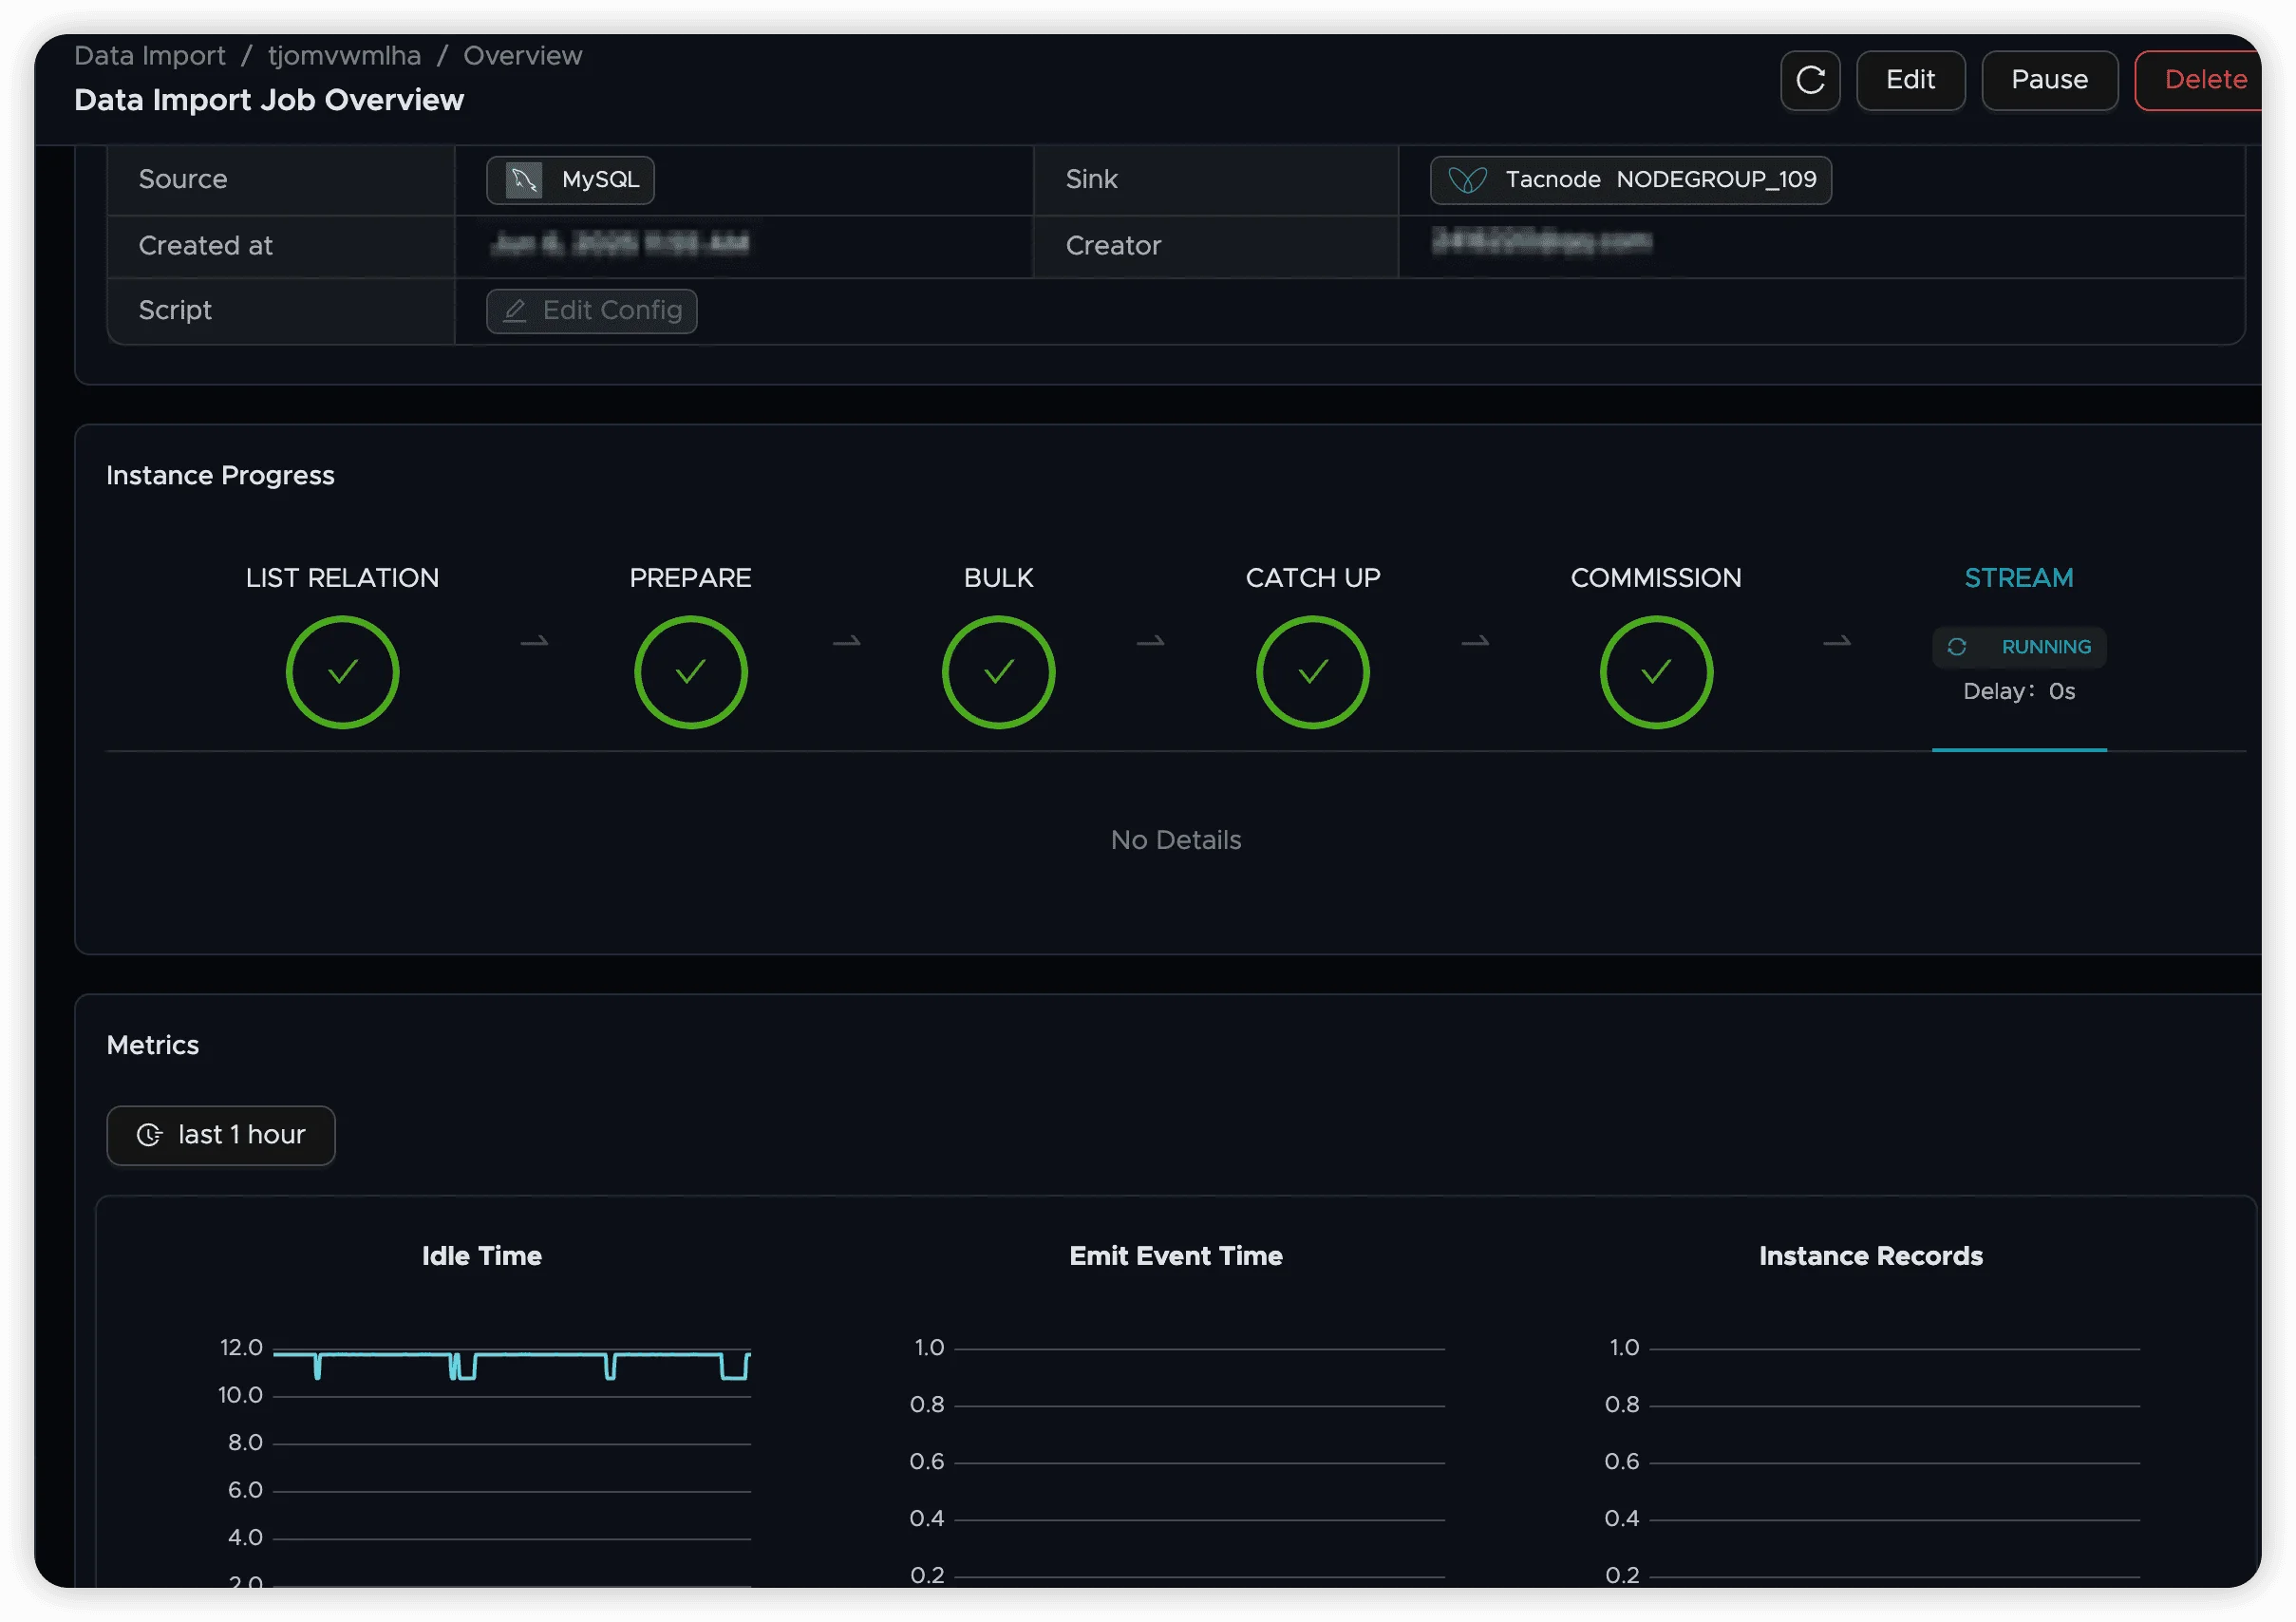
Once a synchronization job is configured and created, you can manage it through various operations on the Tacnode platform. This guide covers the complete job lifecycle and monitoring capabilities.
Job Lifecycle Management
Data Sync jobs support the following operations:
- Start: Initialize and begin the synchronization process
- Pause: Temporarily halt synchronization while preserving state
- Resume: Continue synchronization from where it was paused
- Restart: Reset job state and begin synchronization from the beginning
- Delete: Remove the job and all associated data
Job States
Understanding job states helps you monitor and manage synchronization effectively:
Initializing
- Trigger: Job is starting up and establishing connections
- Available Actions: Pause
- Next State: Running (on success) or Failed (on error)
Running
- Description: Job is actively synchronizing data
- Available Actions: Pause
- Behavior: Continues until manually paused or an error occurs
Paused
- Description: Job is temporarily stopped but retains its position
- Available Actions: Resume, Restart
- Important: For PostgreSQL sources, extended pause periods may cause WAL log accumulation and increased disk usage
Succeeded
- Description: Full synchronization jobs that completed successfully
- Note: Only applies to full synchronization jobs; incremental jobs remain in “Running” state
Failed
- Description: Job encountered an error and stopped
- Available Actions: Restart (after addressing the issue)
Managing Jobs
Resume vs. Restart:
- Resume: Continues from the last synchronized position, preserving progress
- Restart: Resets all progress and begins synchronization from the beginning
Deletion Requirements: Jobs can only be deleted when they are not active (states: never started, paused, succeeded, or failed). Deletion removes all job status and history information permanently.
Job History and Instances
Each time a job is started (including restarts), a new job instance is created. This provides detailed tracking of job execution over time.
Viewing Job History
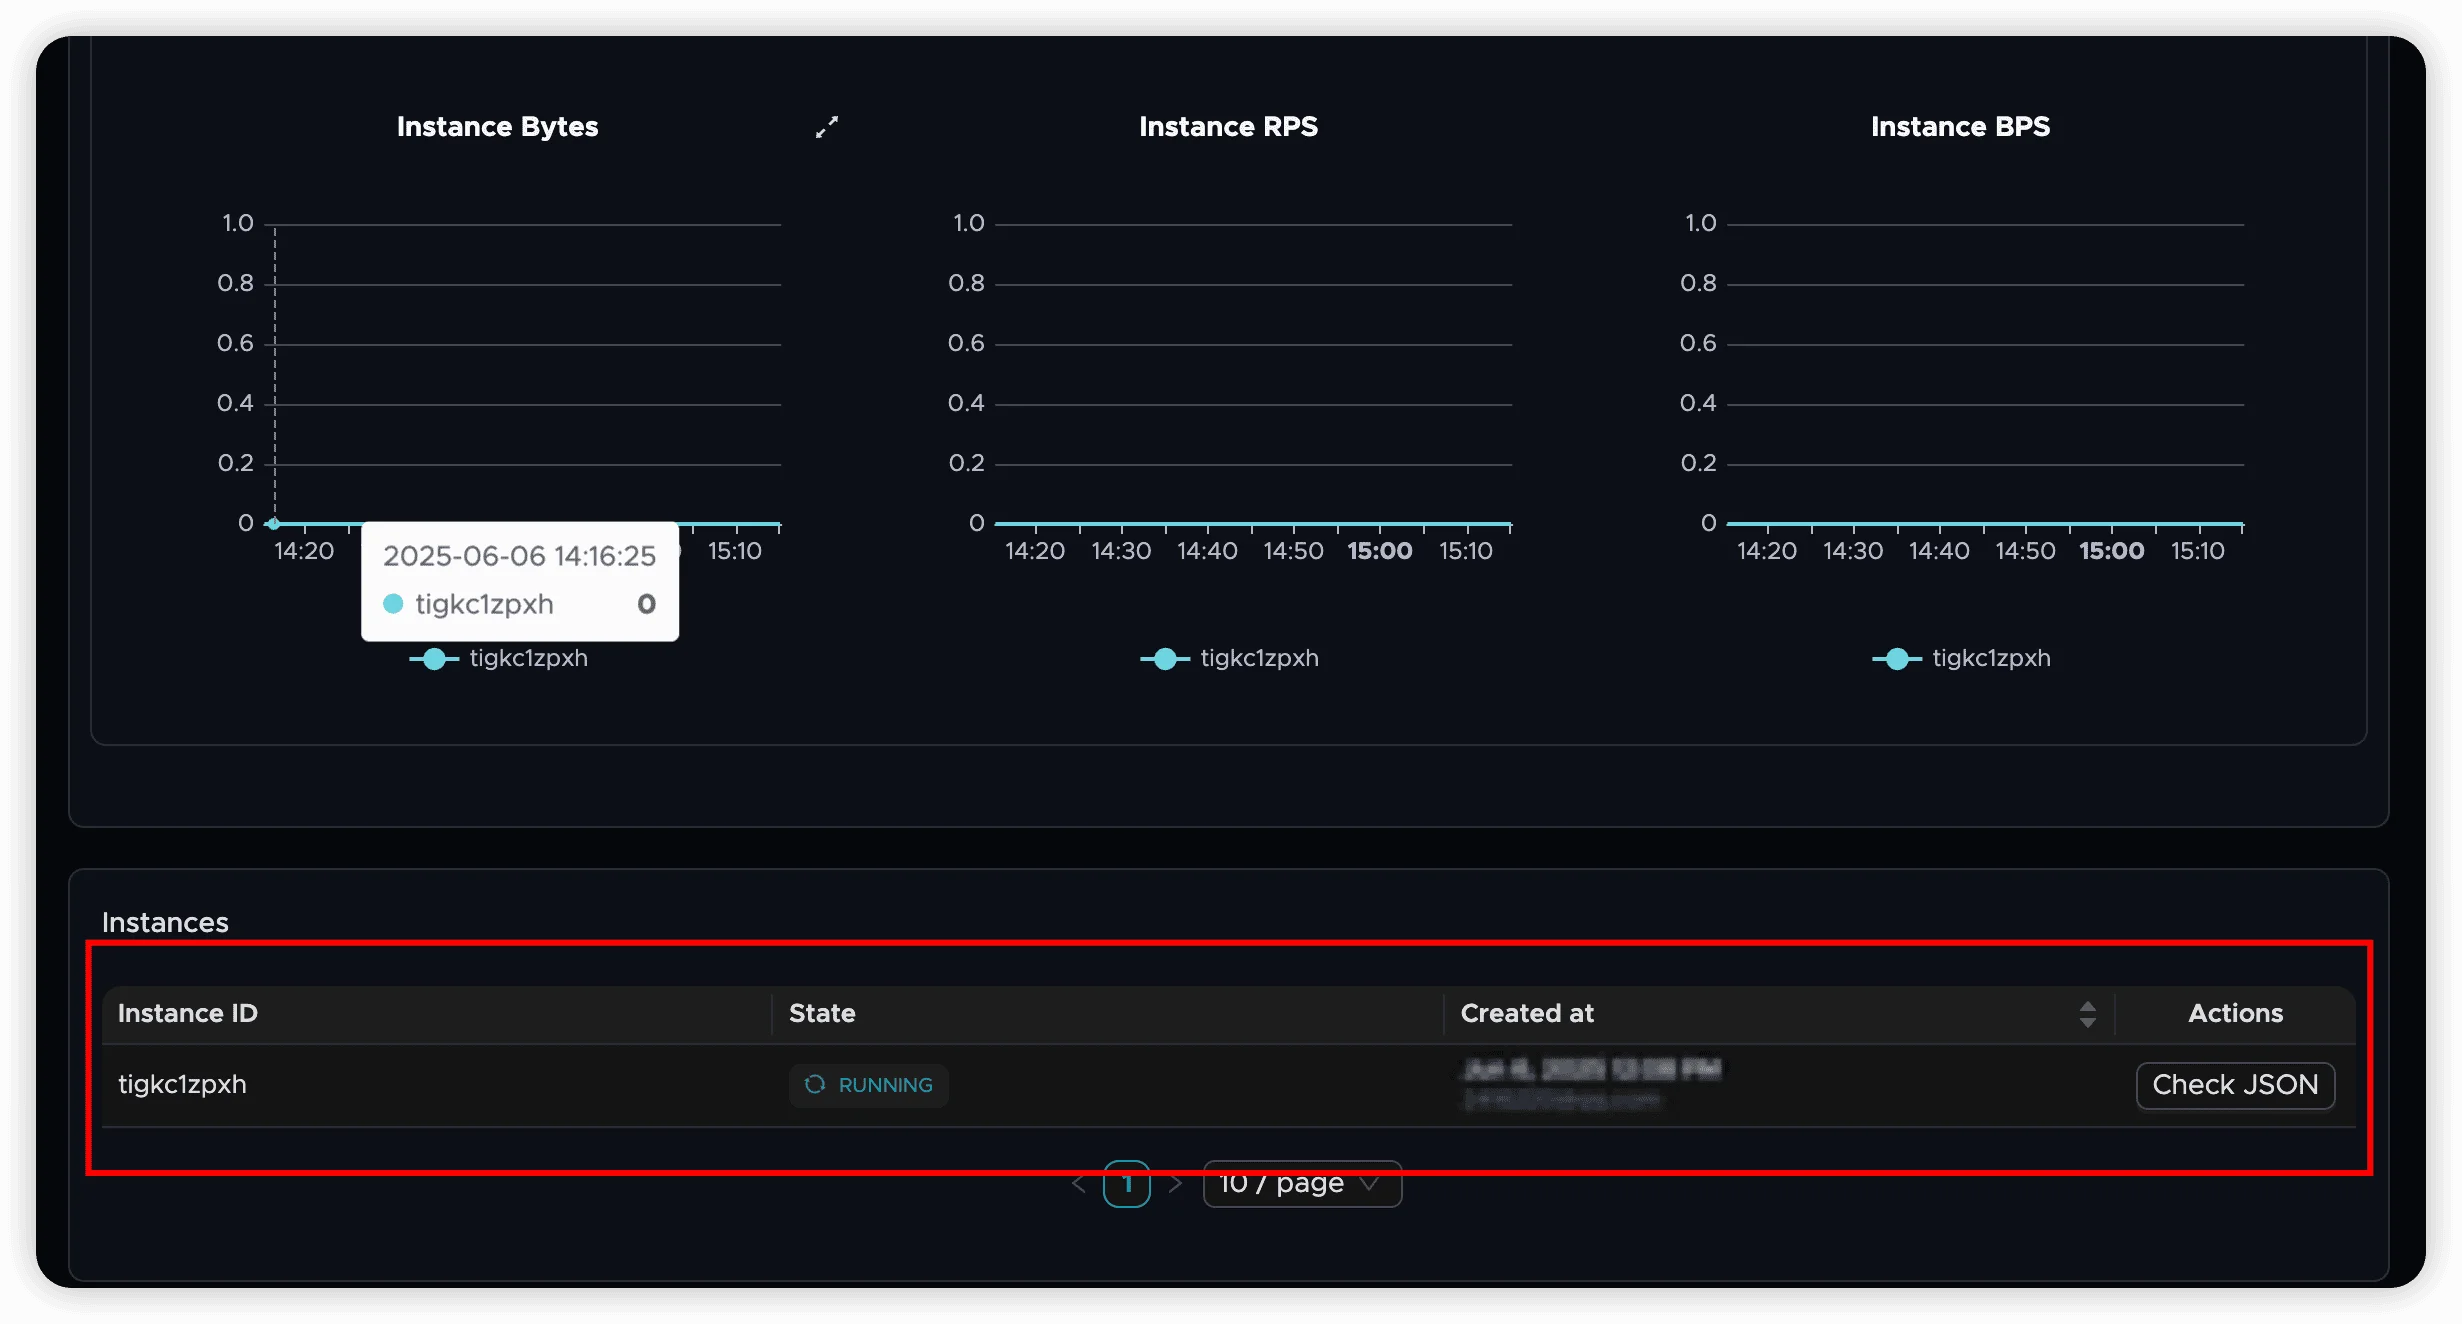
The job history shows:
- Instance ID: Unique identifier for each execution
- Start Time: When the instance began
- Duration: How long the instance ran
- Status: Final state of the instance
- Records Processed: Total number of records synchronized
- Data Volume: Total bytes transferred
Job Monitoring and Metrics
The Data Sync dashboard provides six key performance indicators to help you monitor job health and performance:
Performance Metrics
Latency Indicators
-
Idle Time: Milliseconds between current system time and the last data entry point for synchronization
- Low Value: No significant delay
- High Value: Check if source has new data or if job is experiencing delays
-
Emit Event Time: Milliseconds between the last data processing time and the most recent data entry
- Low and Stable: Normal operation with no source data
- High and Increasing: Significant job delay requiring attention
Throughput Metrics
- Instance Records: Total count of records processed by the job
- Instance Bytes: Total number of bytes handled by the job
- Instance RPS: Records processed per second (current rate)
- Instance BPS: Bytes processed per second (current rate)
Interpreting Metrics
Normal Operation:
- Idle Time: Minimal (< 1000ms)
- Emit Event Time: Low and stable
- RPS/BPS: Consistent with data arrival patterns
No Source Data:
- Idle Time: High but stable
- Emit Event Time: Low and unchanged
- RPS/BPS: Zero or very low
Performance Issues:
- Idle Time: High and increasing
- Emit Event Time: High and increasing (approximately equal to Idle Time)
- RPS/BPS: Below expected levels
Best Practices
Monitoring
- Regular Health Checks: Monitor Idle Time and Emit Event Time regularly
- Set Alerts: Configure alerts for prolonged high latency values
- Track Trends: Monitor RPS and BPS trends to identify performance degradation
Operational Management
- Planned Maintenance: Use Pause/Resume for scheduled maintenance windows
- Error Recovery: Investigate failed jobs before restarting
- Resource Planning: Monitor throughput metrics to plan for capacity changes
PostgreSQL Specific
- WAL Management: Avoid extended pause periods to prevent disk space issues
- Connection Monitoring: Ensure replication connections remain stable
- Performance Tuning: Monitor database performance impact during synchronization