
AWS CloudWatch Integration
Learn how to integrate Tacnode with AWS CloudWatch for centralized monitoring, alerting, and observability across your AWS infrastructure.
Integrate Tacnode with AWS CloudWatch to centralize your monitoring and alerting infrastructure. This integration enables you to push Tacnode metrics to CloudWatch, view them in the AWS Console, and set up sophisticated alerting based on your operational requirements.
Integration Benefits
Centralized Monitoring
- Unified dashboard for all AWS services and Tacnode metrics
- Consistent monitoring experience across your infrastructure
- Simplified operational procedures and training
Advanced Alerting Capabilities
- CloudWatch alarm integration with SNS, Lambda, and other AWS services
- Sophisticated alerting rules and escalation procedures
- Integration with existing incident management systems
Long-term Retention and Analysis
- Extended metric retention periods
- Advanced analytics with CloudWatch Insights
- Cost-effective storage for historical monitoring data
Prerequisites
Before configuring CloudWatch integration, ensure you have:
- Active AWS account with CloudWatch service enabled
- Appropriate IAM permissions for CloudWatch operations
- Tacnode instance with administrative access
- Understanding of AWS IAM roles and policies
Configuration Steps
Step 1: Create IAM Permission Policy
Create a dedicated policy for Tacnode metric operations in CloudWatch.
-
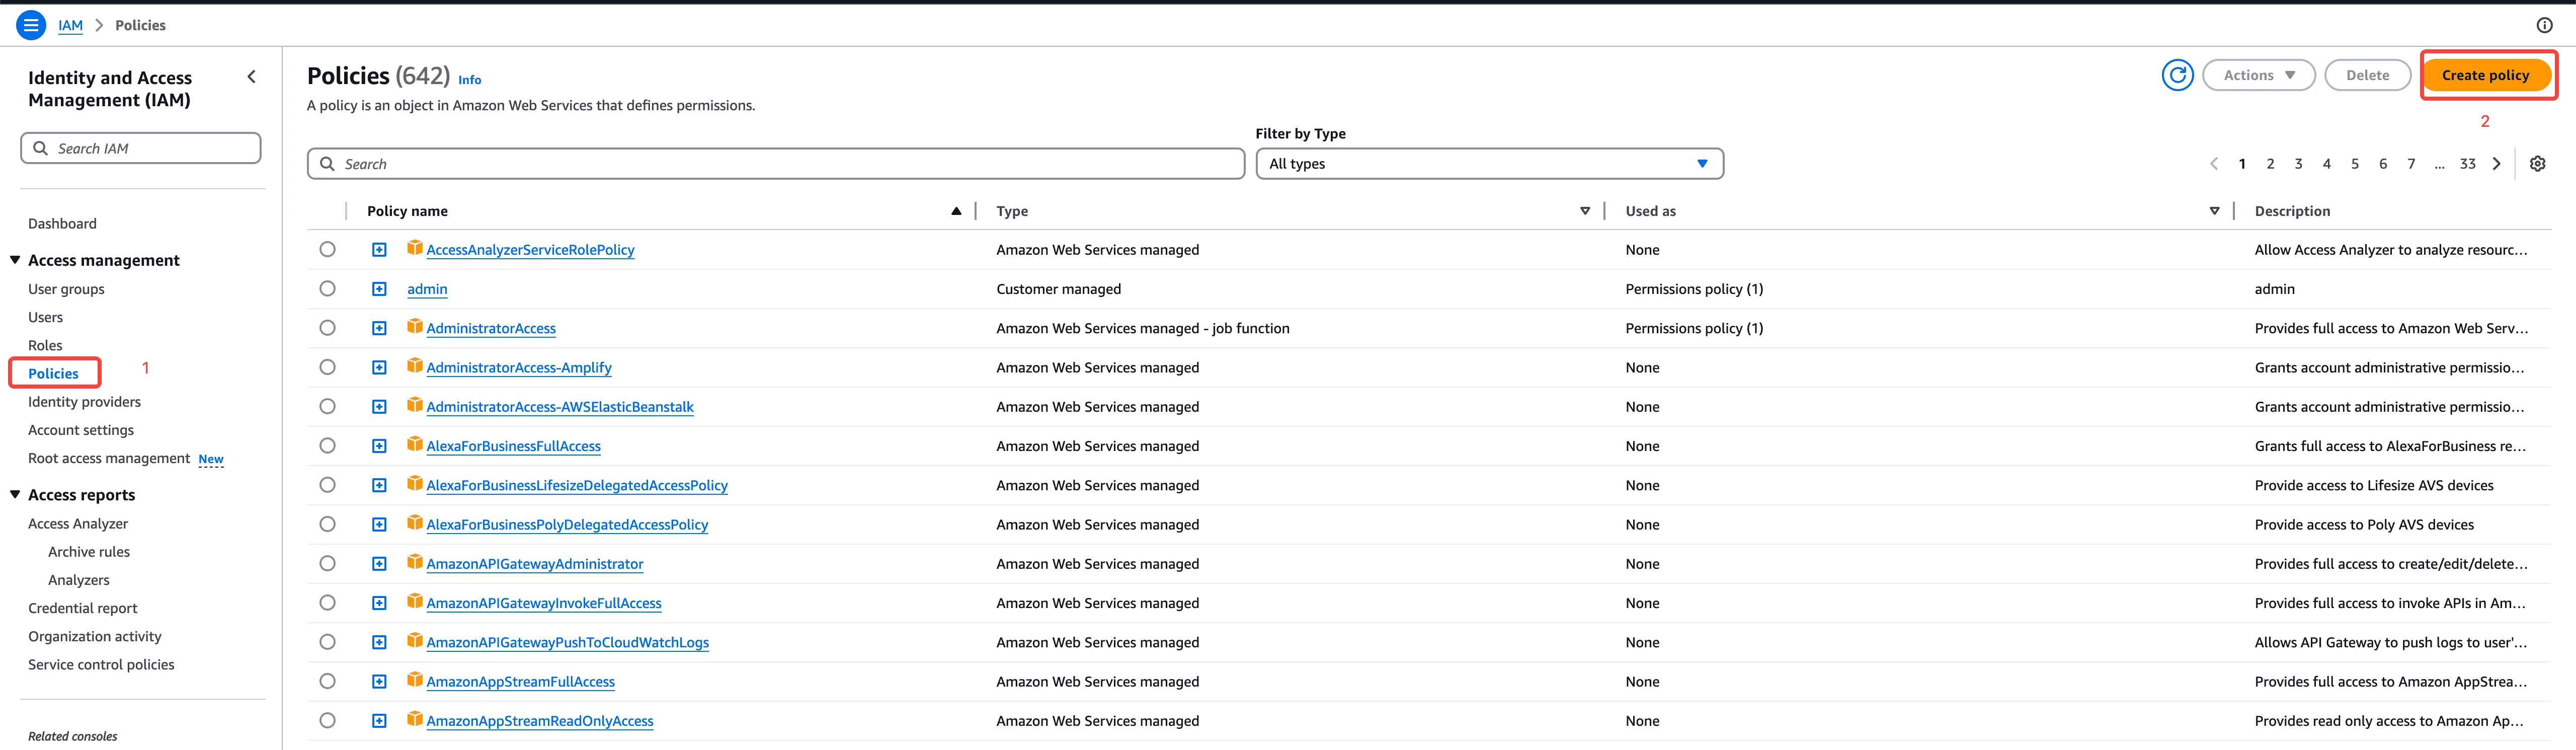
Navigate to IAM Policy Management
- Go to the AWS IAM Console
- Select “Policies” from the navigation menu
-
Create New Policy
- Click “Create policy”
- Choose “JSON” tab for policy editor
- Enter the following policy definition:
{
    "Version": "2012-10-17",
    "Statement": [
        {
            "Sid": "TacnodeCloudWatchAccess",
            "Effect": "Allow",
            "Action": [
                "cloudwatch:ListMetrics",
                "cloudwatch:GetMetricData",
                "cloudwatch:GetMetricStatistics",
                "cloudwatch:PutMetricData",
                "cloudwatch:PutMetricAlarm",
                "cloudwatch:TagResource",
                "cloudwatch:UntagResource"
            ],
            "Resource": "*"
        }
    ]
}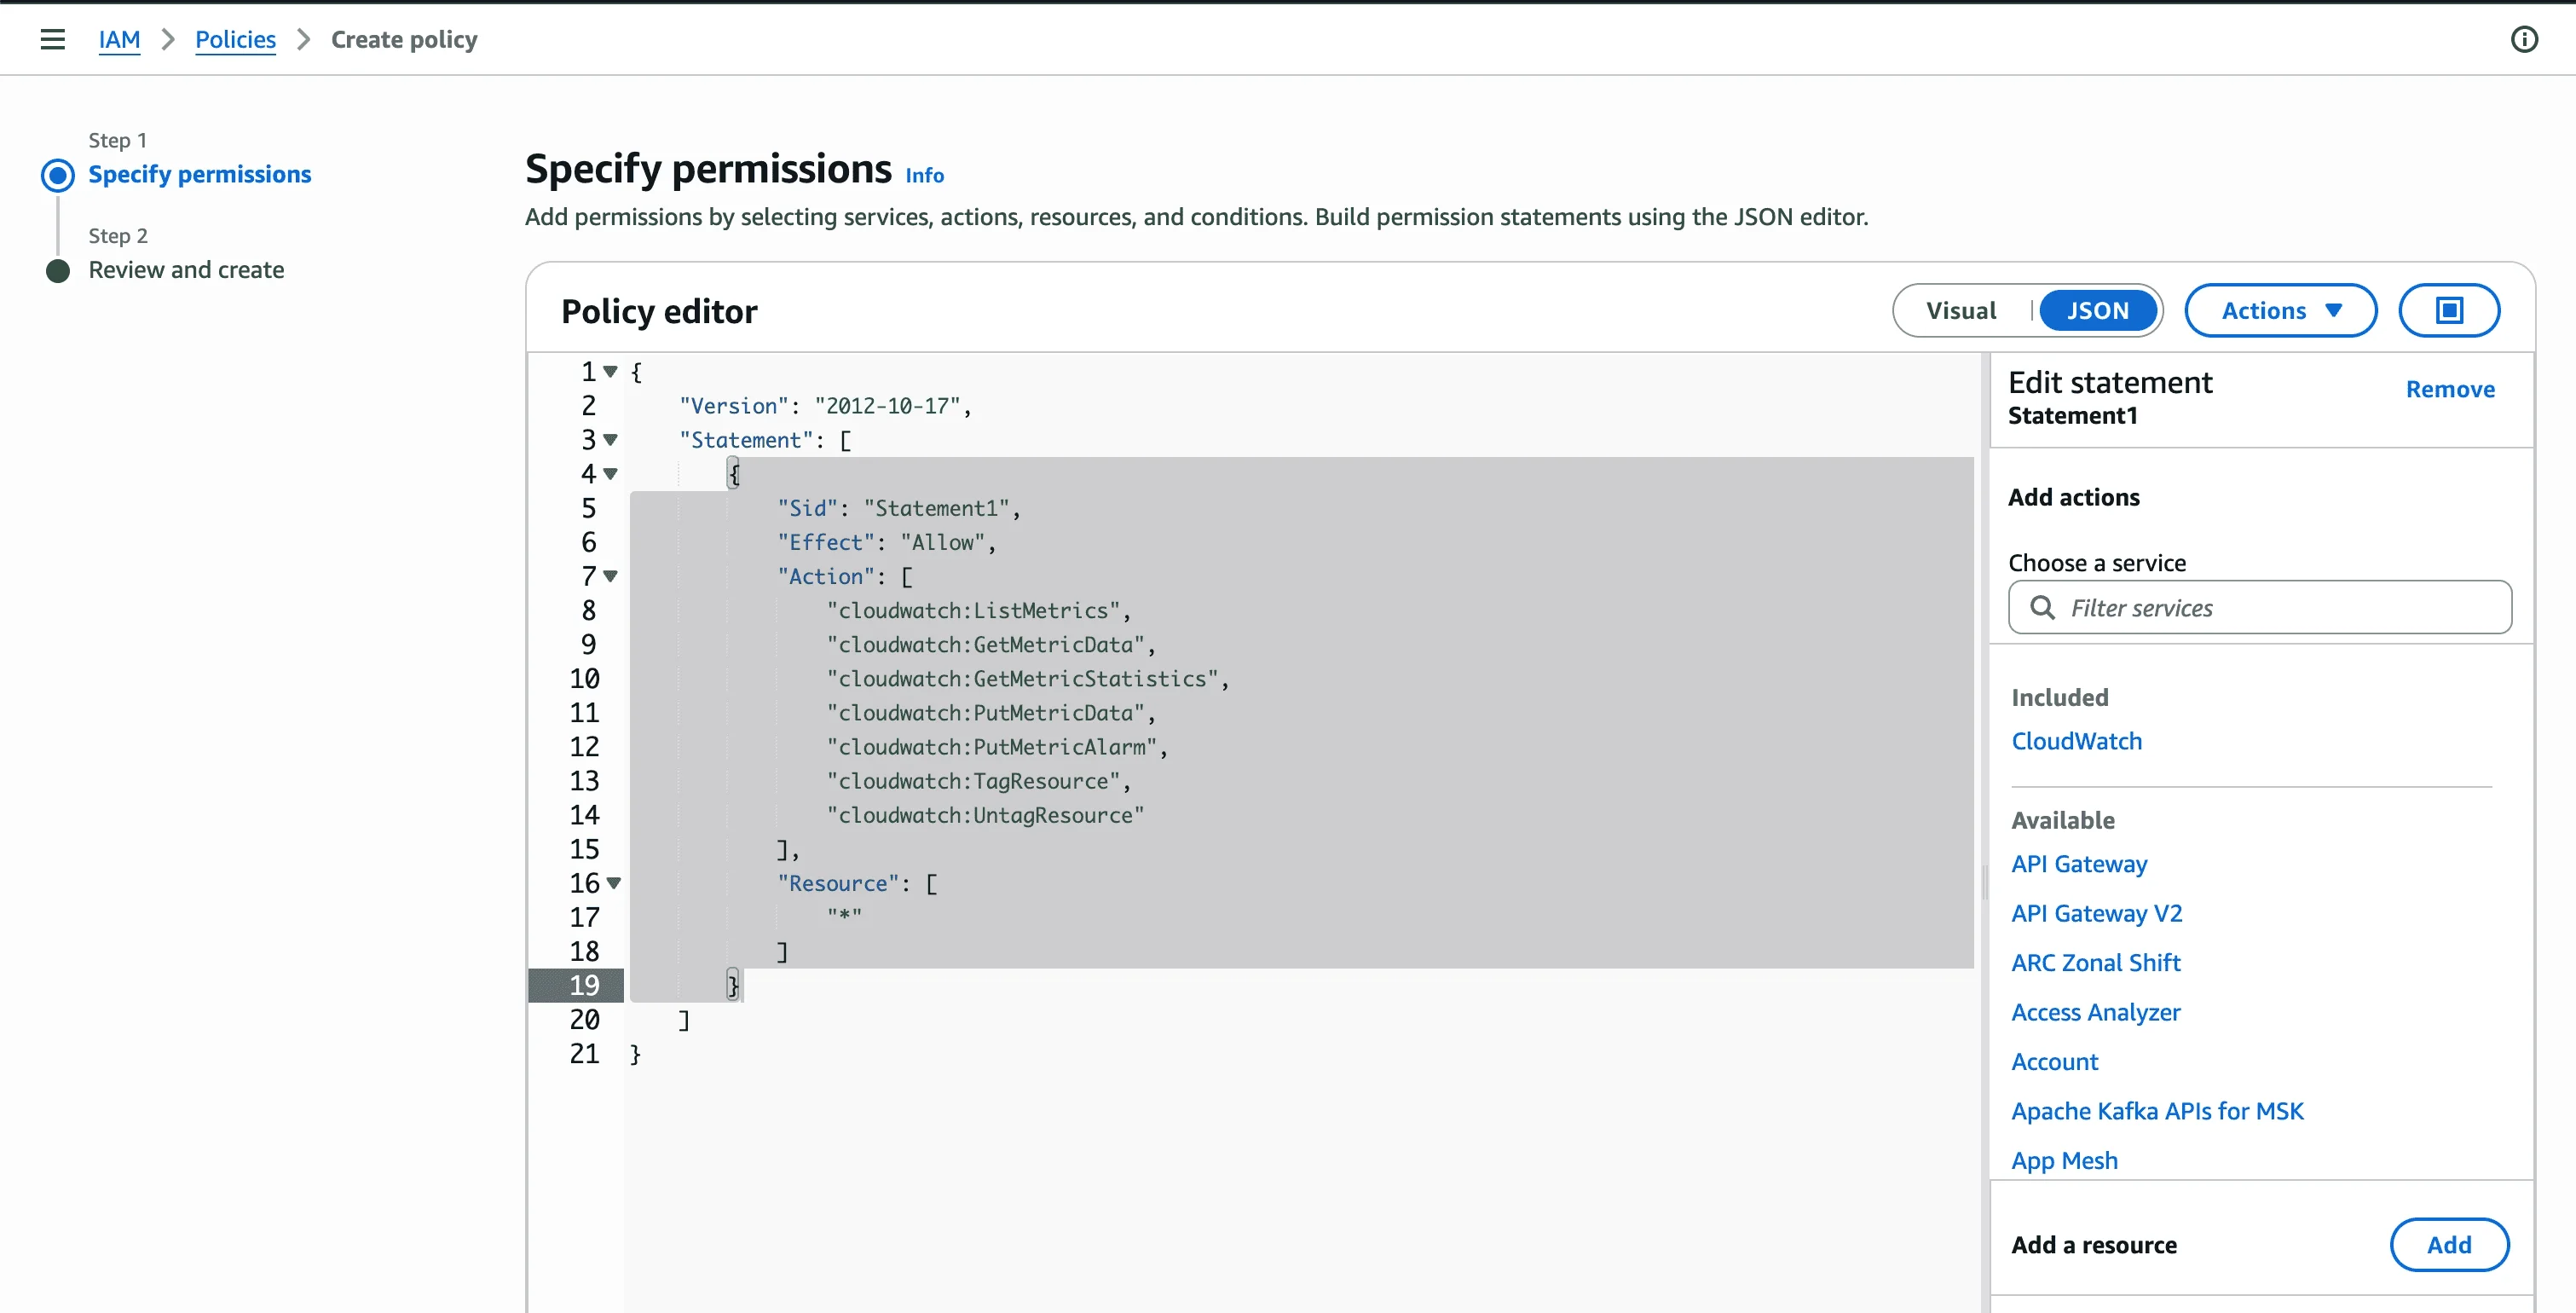
-
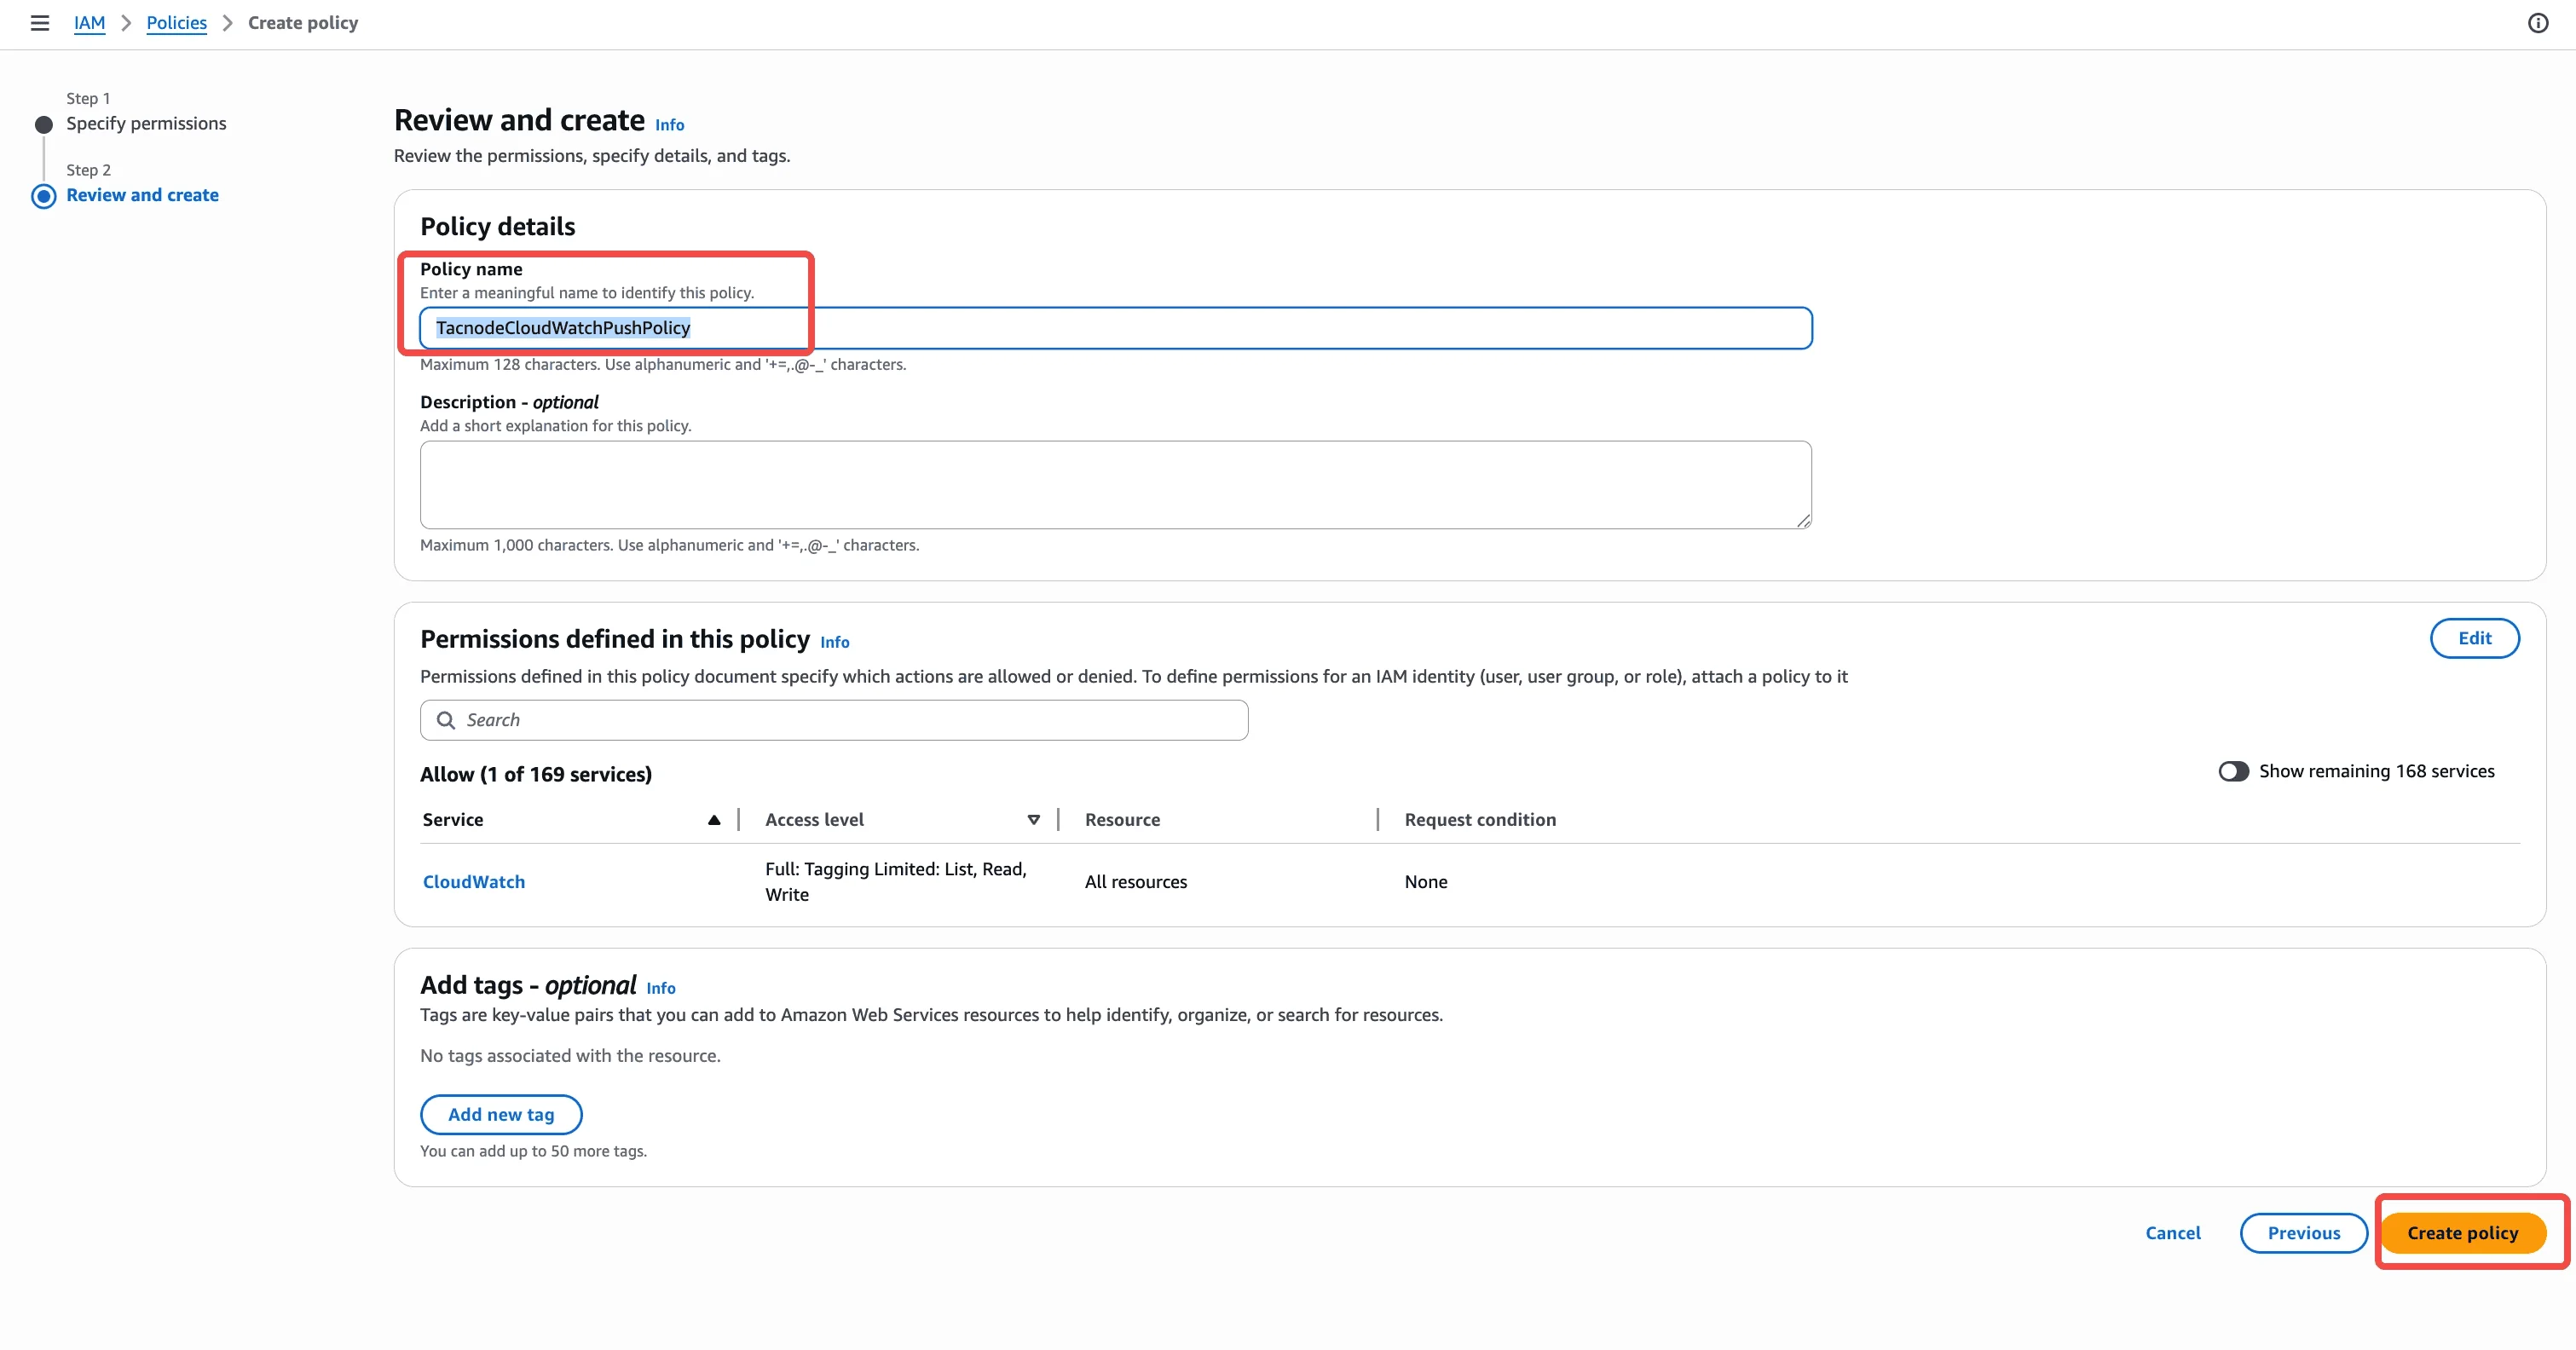
Save Policy
- Name the policy
TacnodeCloudWatchPushPolicy - Add description: “Allows Tacnode to push metrics to CloudWatch”
- Click “Create policy”
- Name the policy
Step 2: Create IAM Role
Set up an IAM role that Tacnode can assume to push metrics to CloudWatch.
-
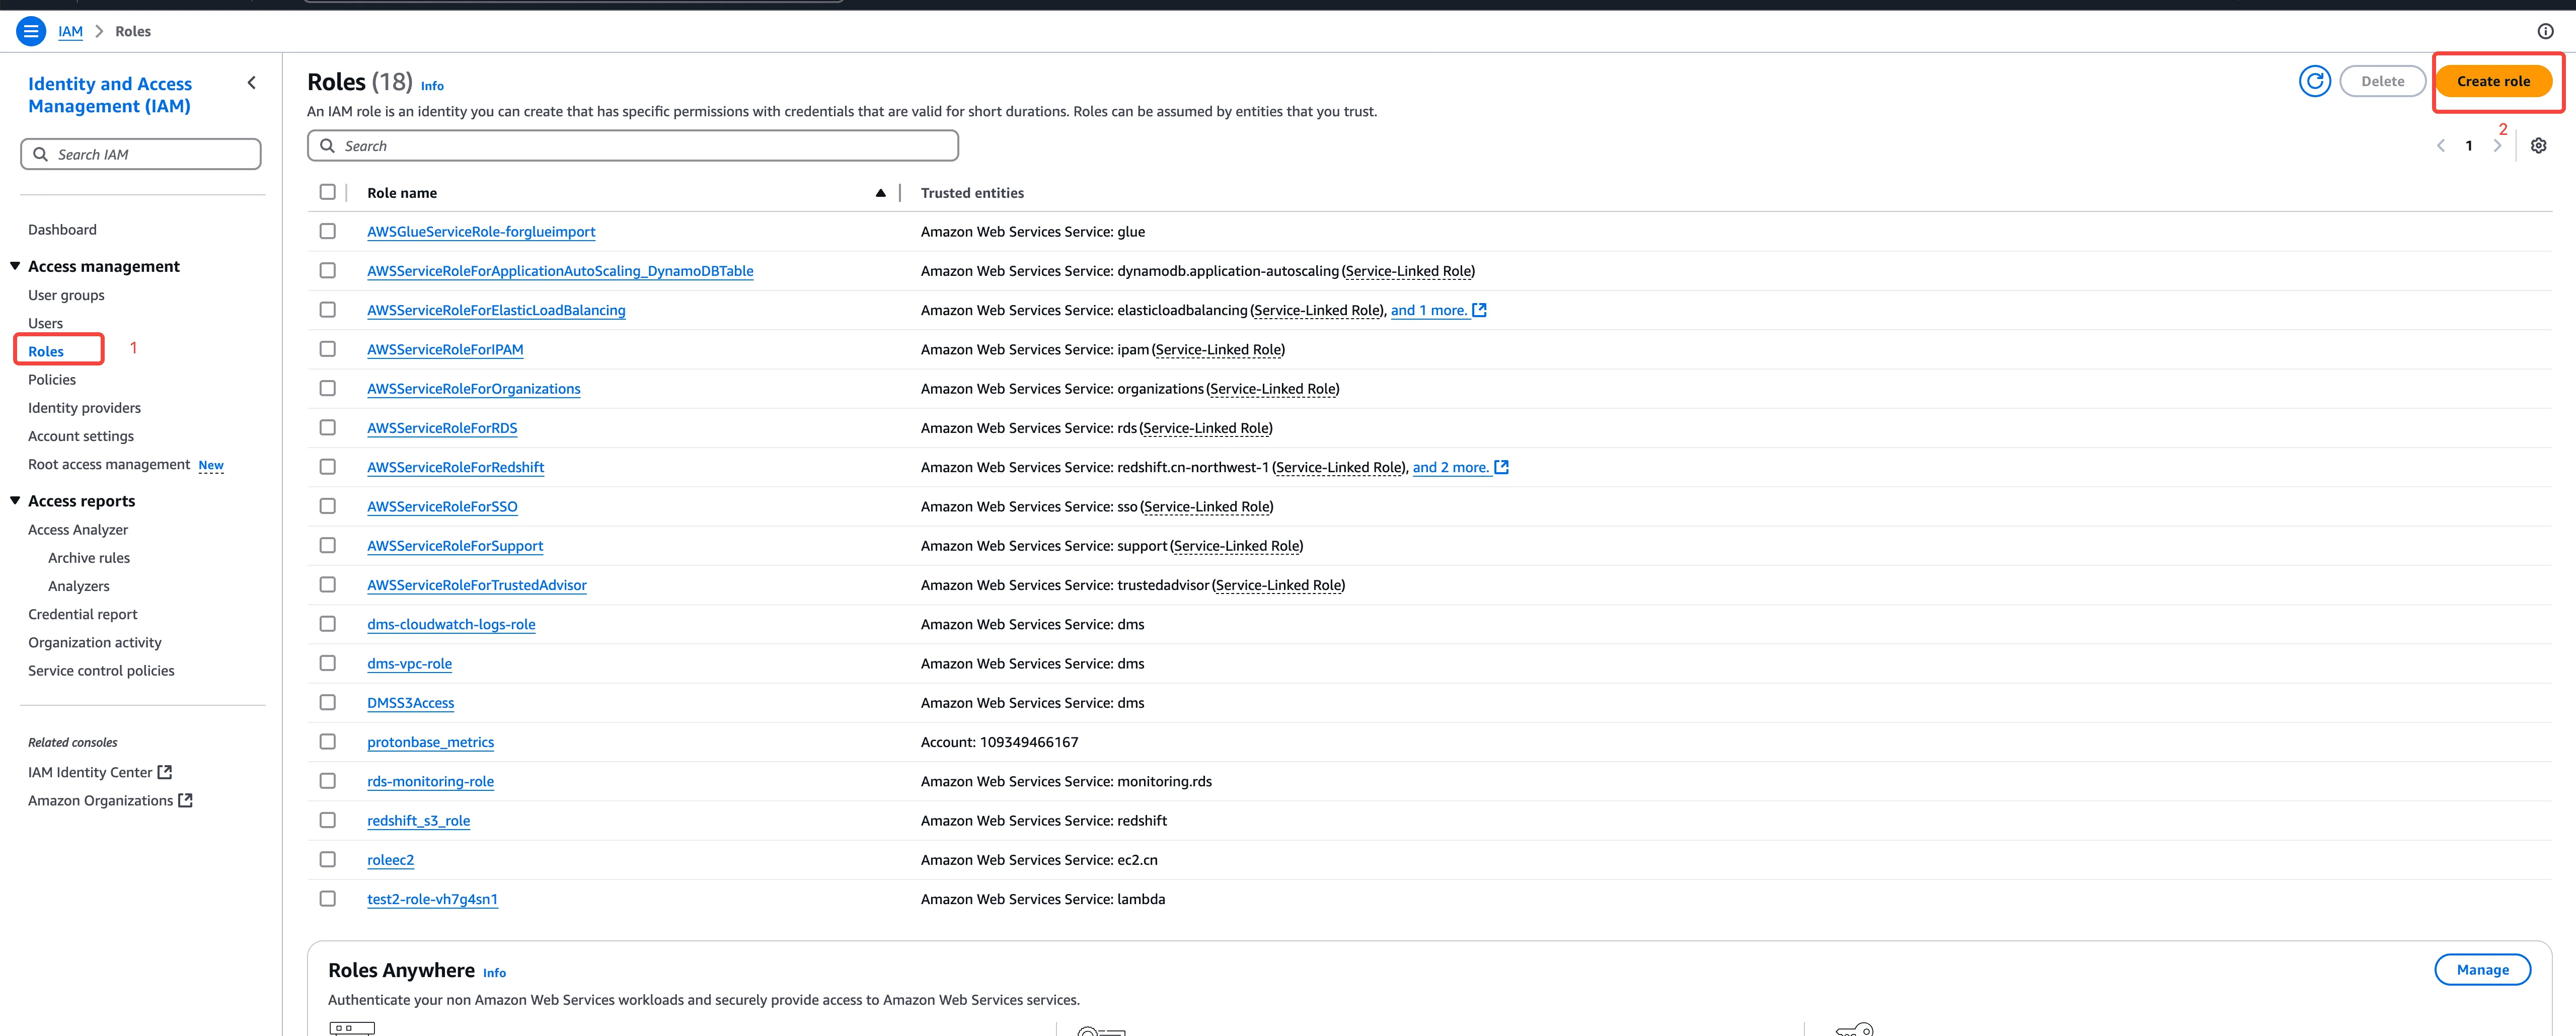
Navigate to IAM Roles
- Go to IAM Console → Roles
- Click “Create role”
-
Configure Trust Policy
- Select “Custom trust policy”
- Replace
{ACCOUNT_ID}with your actual AWS account ID:
{
    "Version": "2012-10-17",
    "Statement": [
        {
            "Effect": "Allow",
            "Principal": {
                "AWS": "arn:aws:iam::{ACCOUNT_ID}:root"
            },
            "Action": "sts:AssumeRole",
            "Condition": {}
        }
    ]
}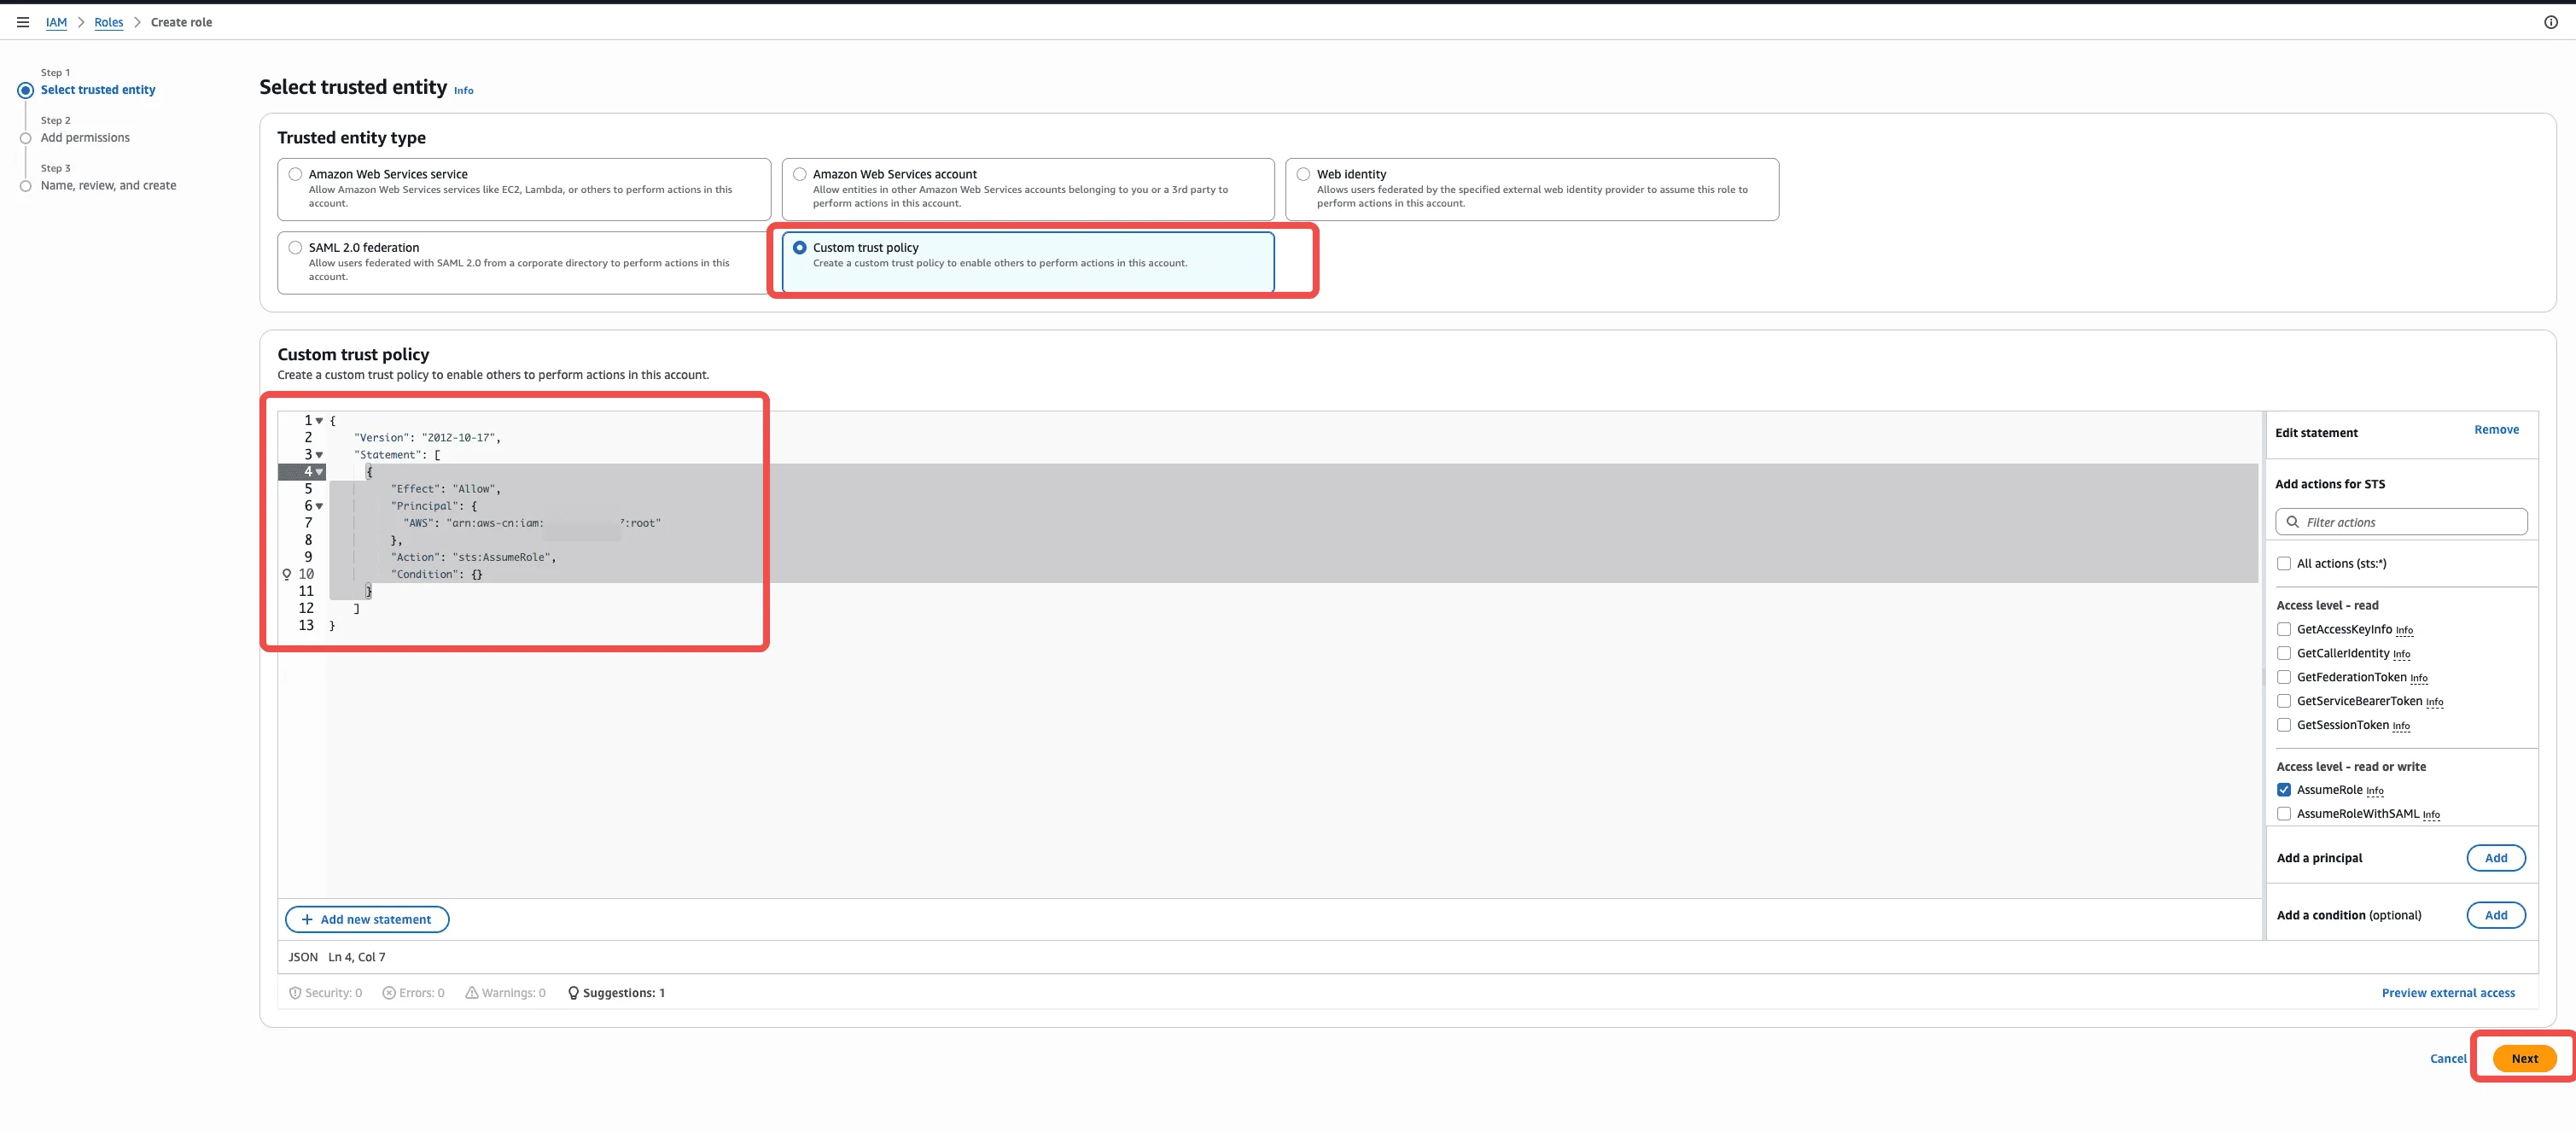
-
Attach Permissions
- Search for and select
TacnodeCloudWatchPushPolicy - Click “Next” to continue
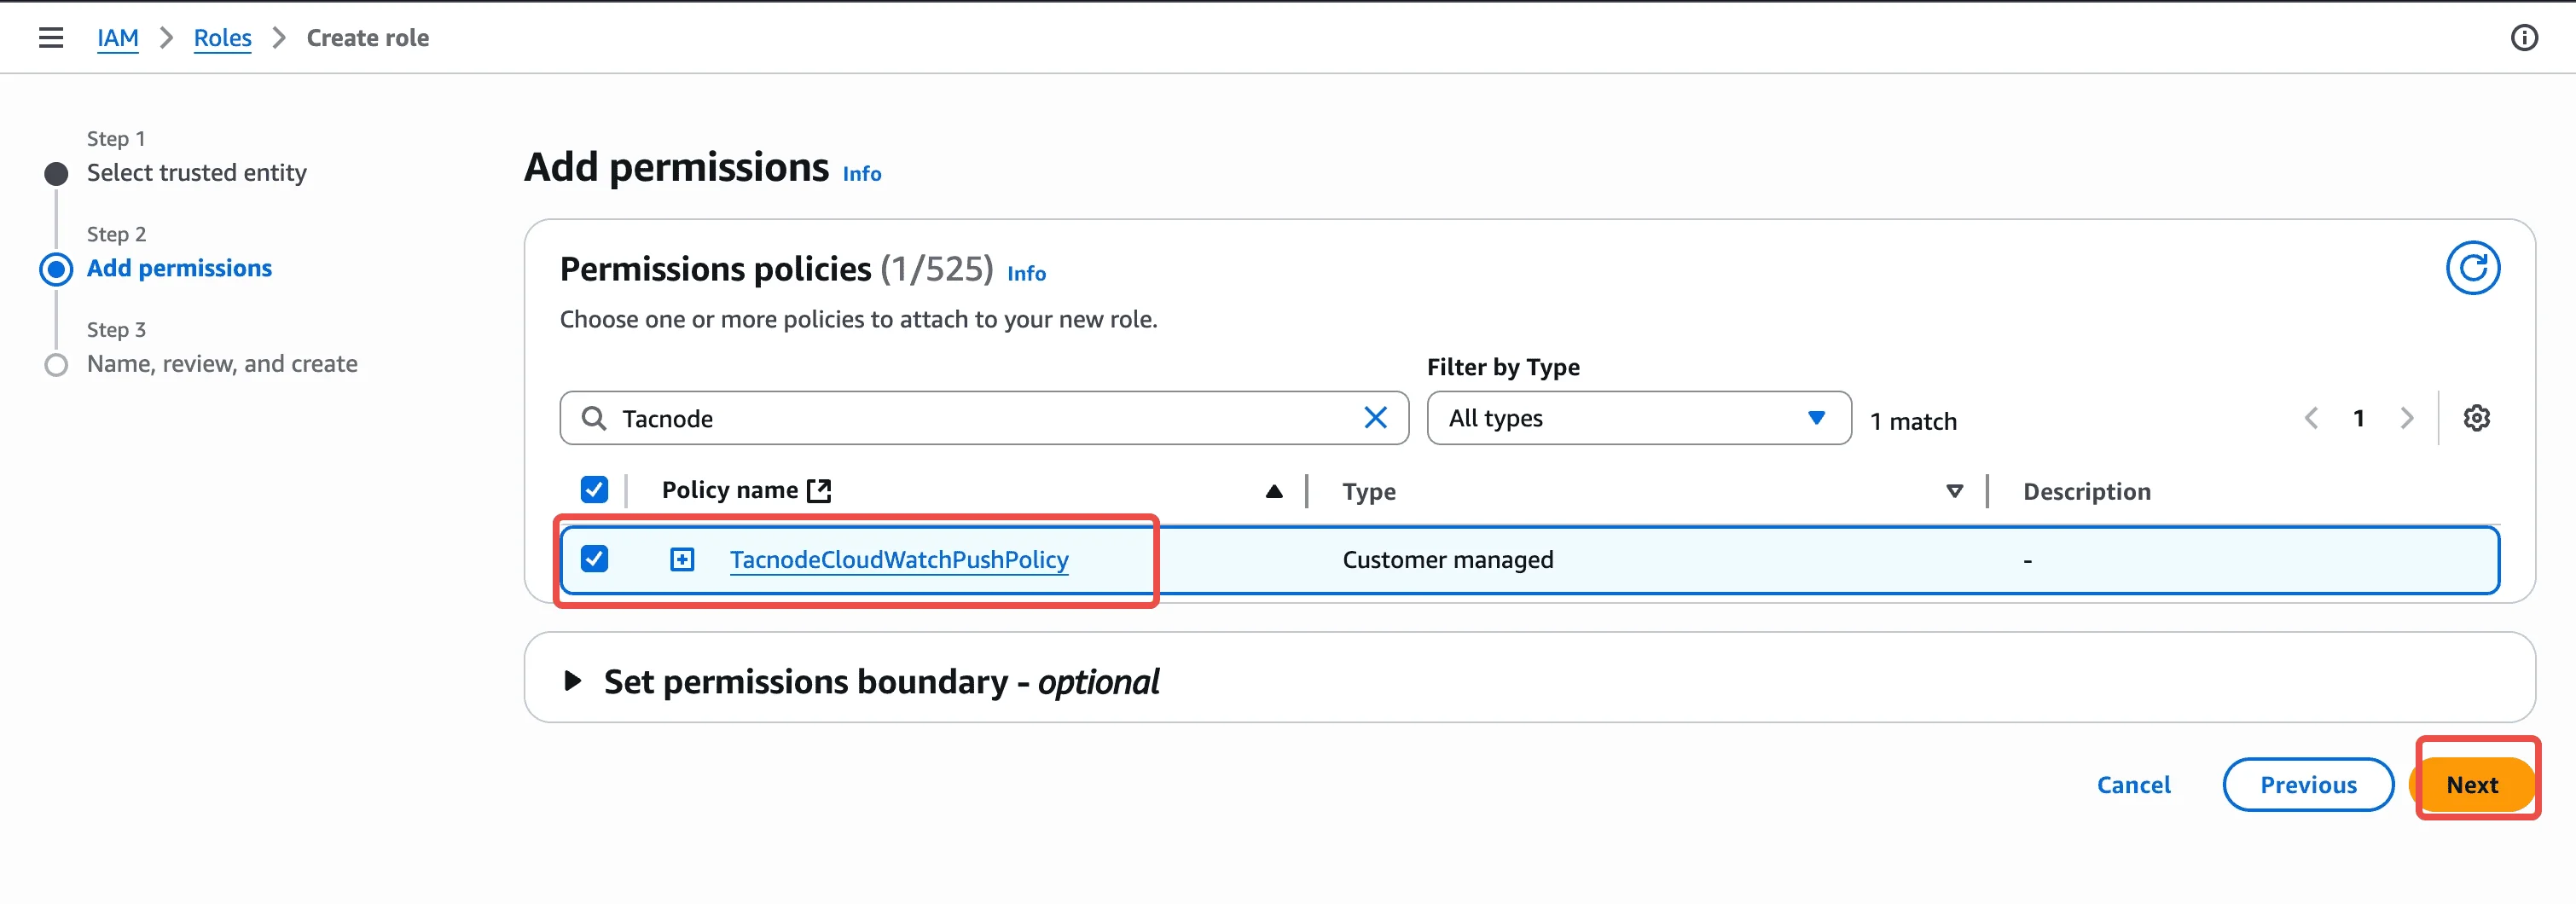
- Search for and select
-
Finalize Role Creation
- Role name:
TacnodeMetricsRole - Description: “Role for Tacnode to push metrics to CloudWatch”
- Review settings and click “Create role”
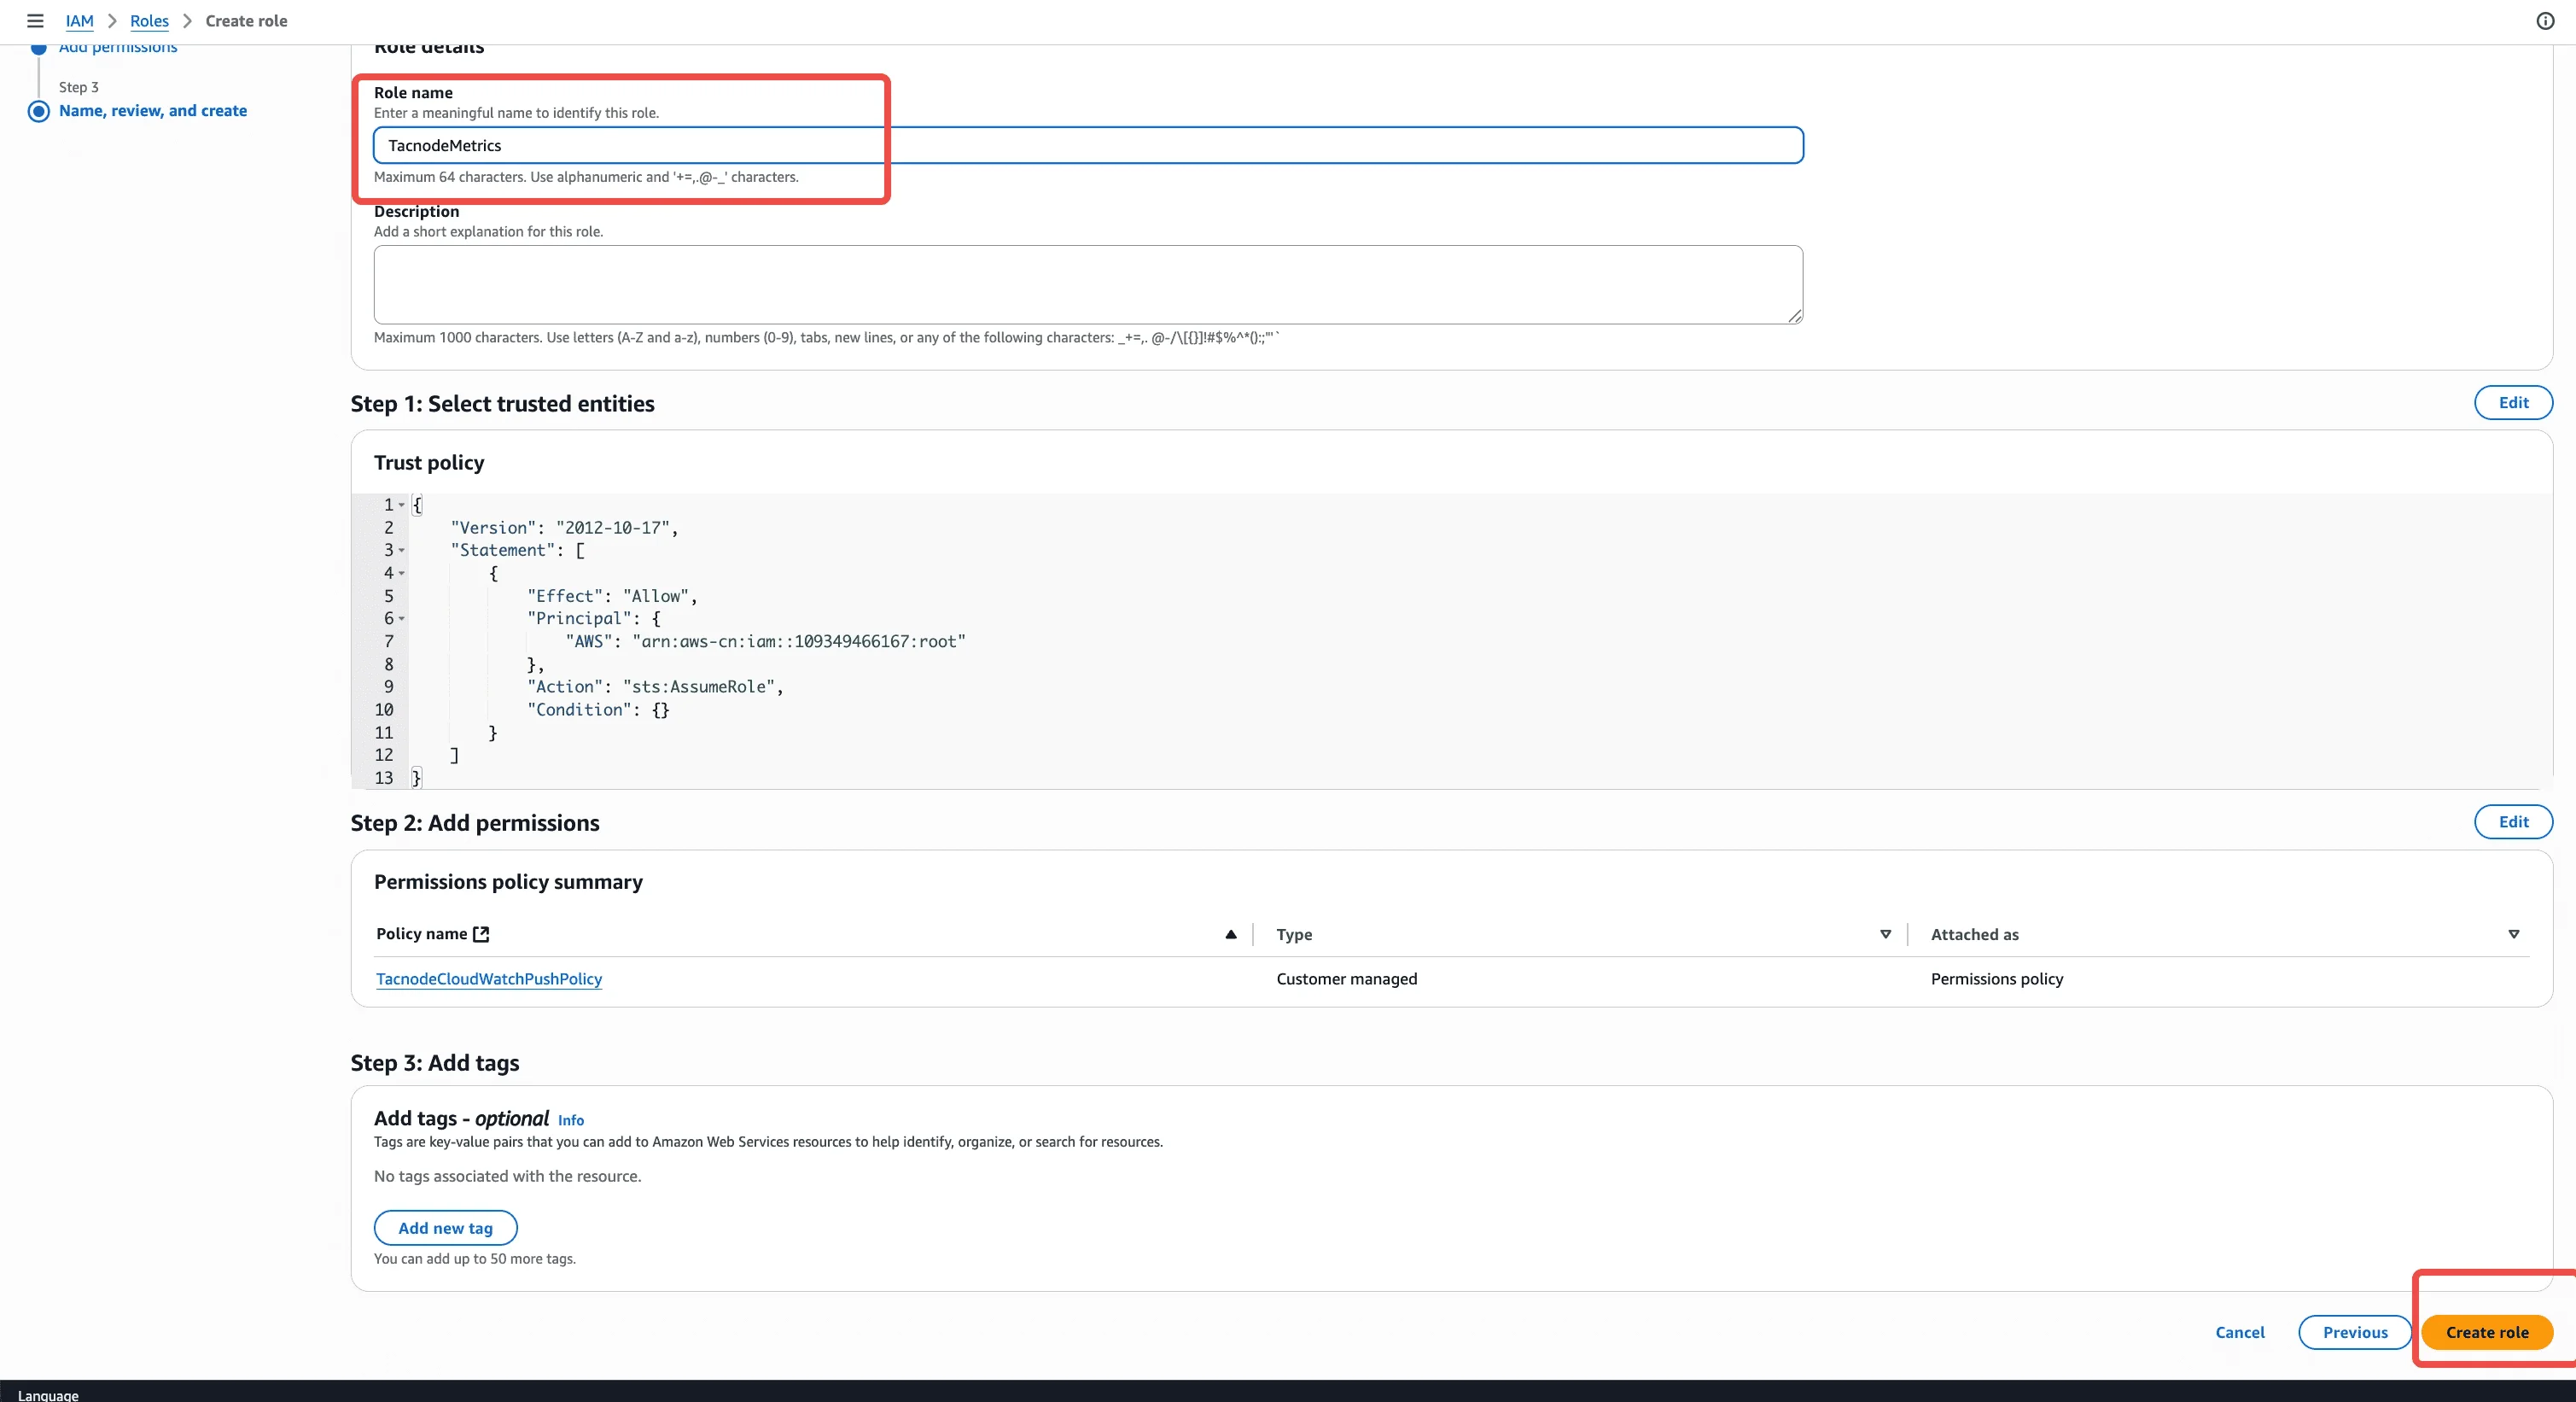
- Role name:
-
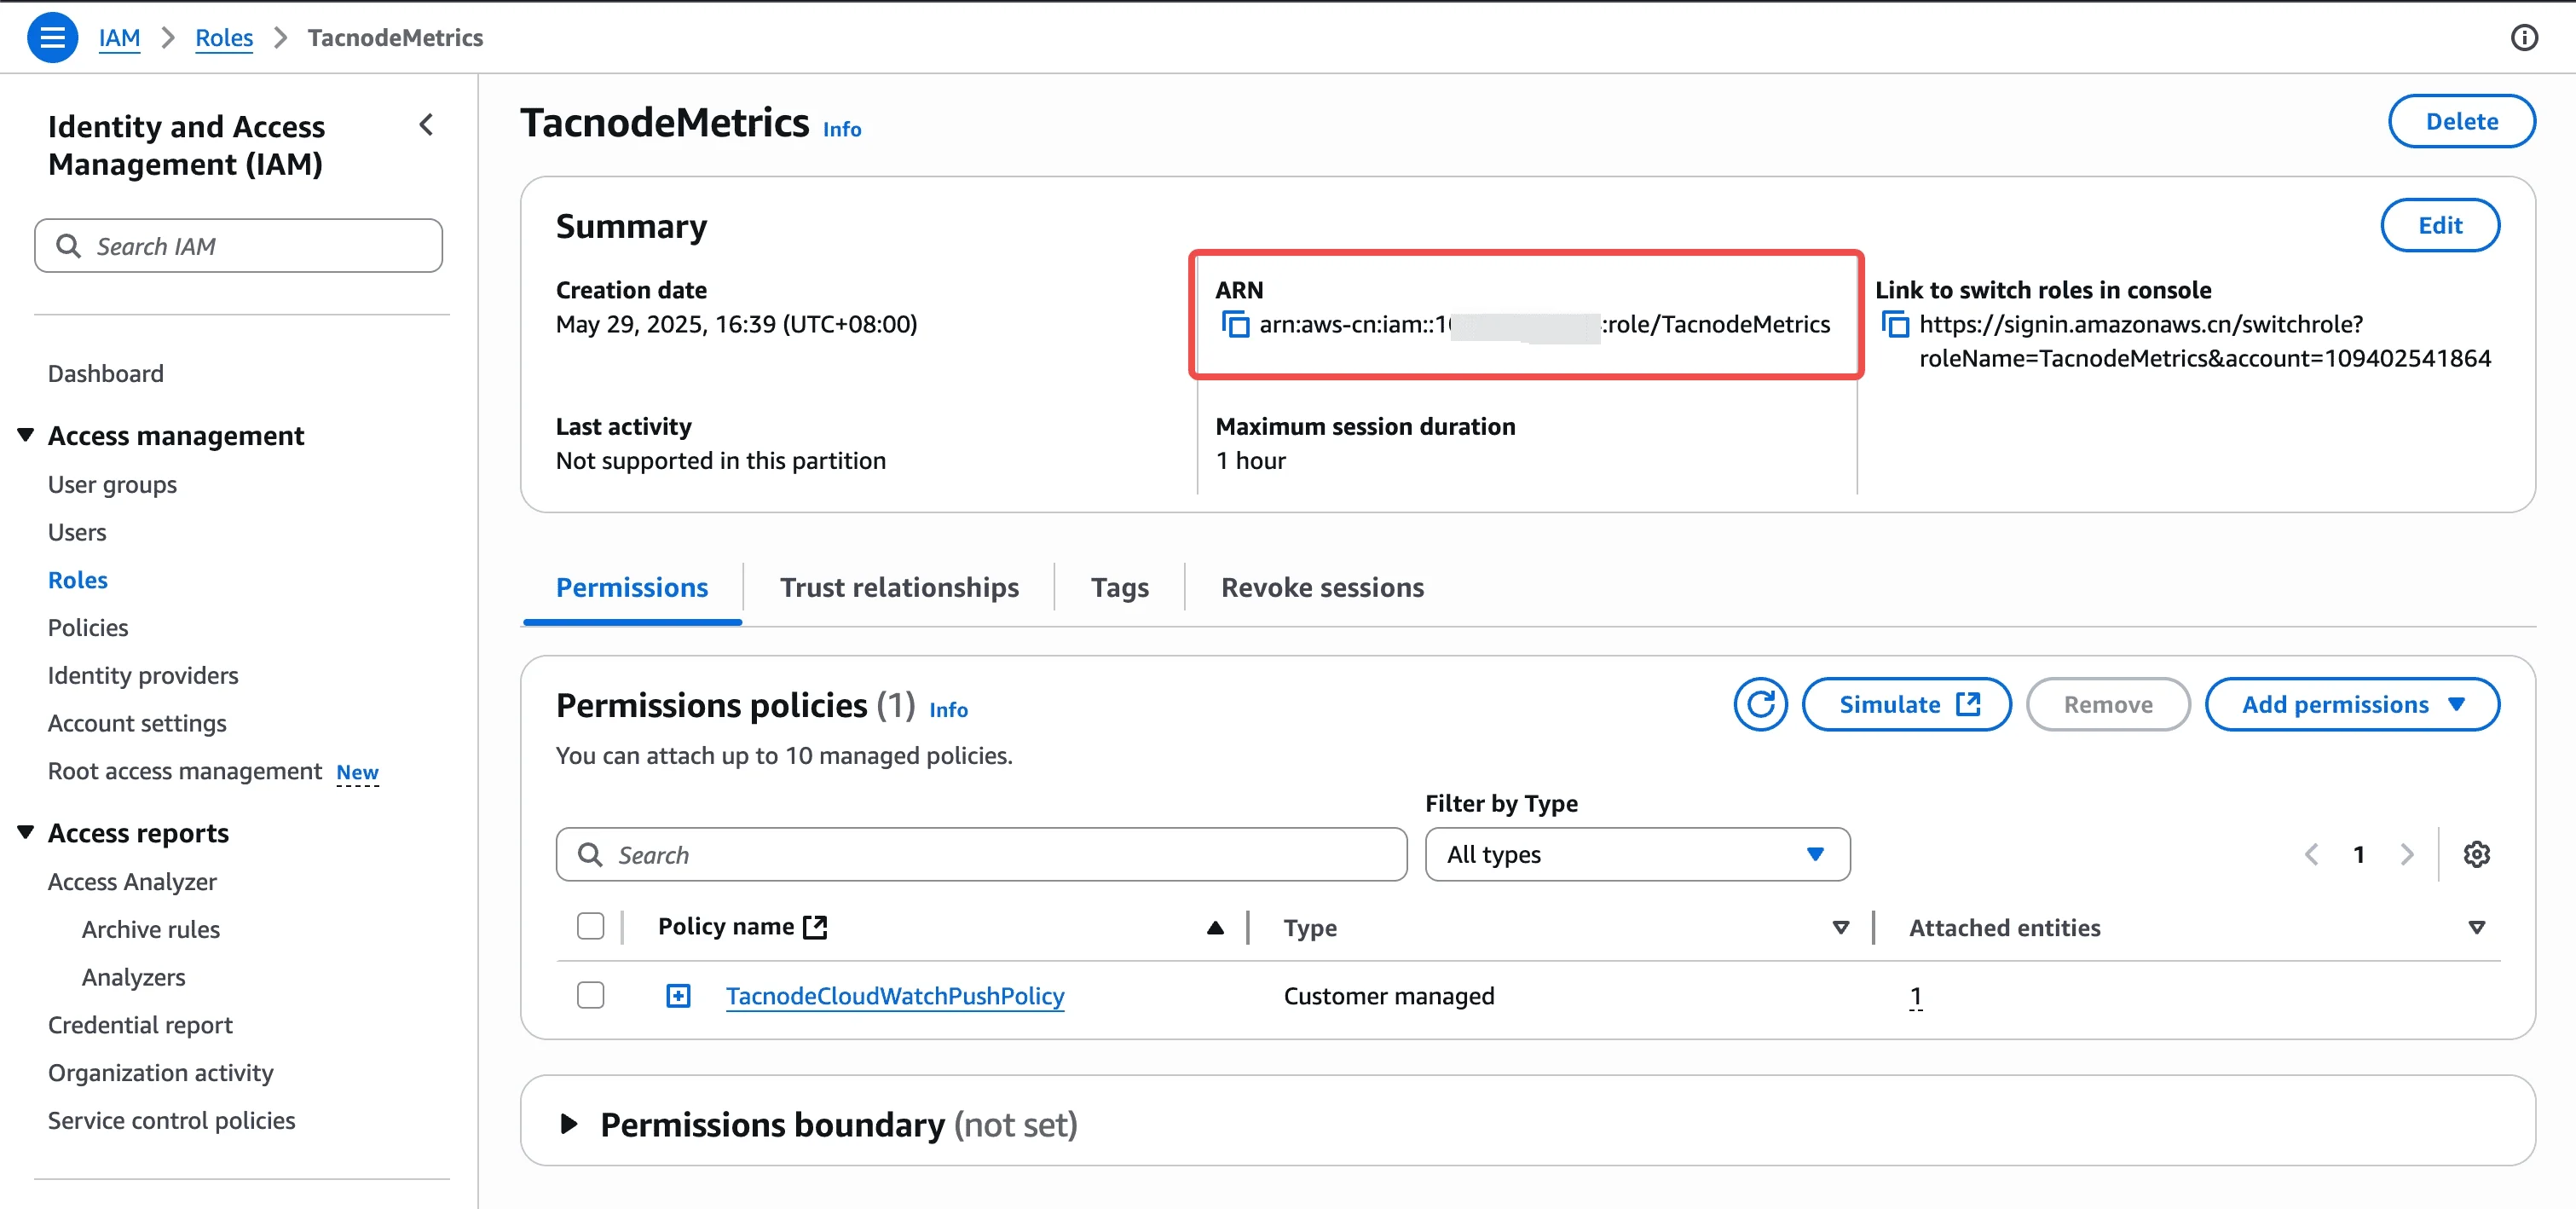
Copy Role ARN
- Navigate to the created role
- Copy the Role ARN for use in Tacnode configuration
Step 3: Configure Tacnode CloudWatch Integration
Set up the CloudWatch subscription in your Tacnode console.
-
Access Integration Settings
- Log into your Tacnode console
- Navigate to Settings → Integrations → CloudWatch
-
Configure Integration Parameters
- Namespace: Custom CloudWatch namespace (e.g.,
Tacnode/Production) - Role ARN: Paste the IAM role ARN from previous step
- AWS Region: Select your target AWS region:
us-west-2for US West (Oregon)us-east-1for US East (N. Virginia)ap-northeast-1for Asia Pacific (Tokyo)eu-west-1for Europe (Ireland)
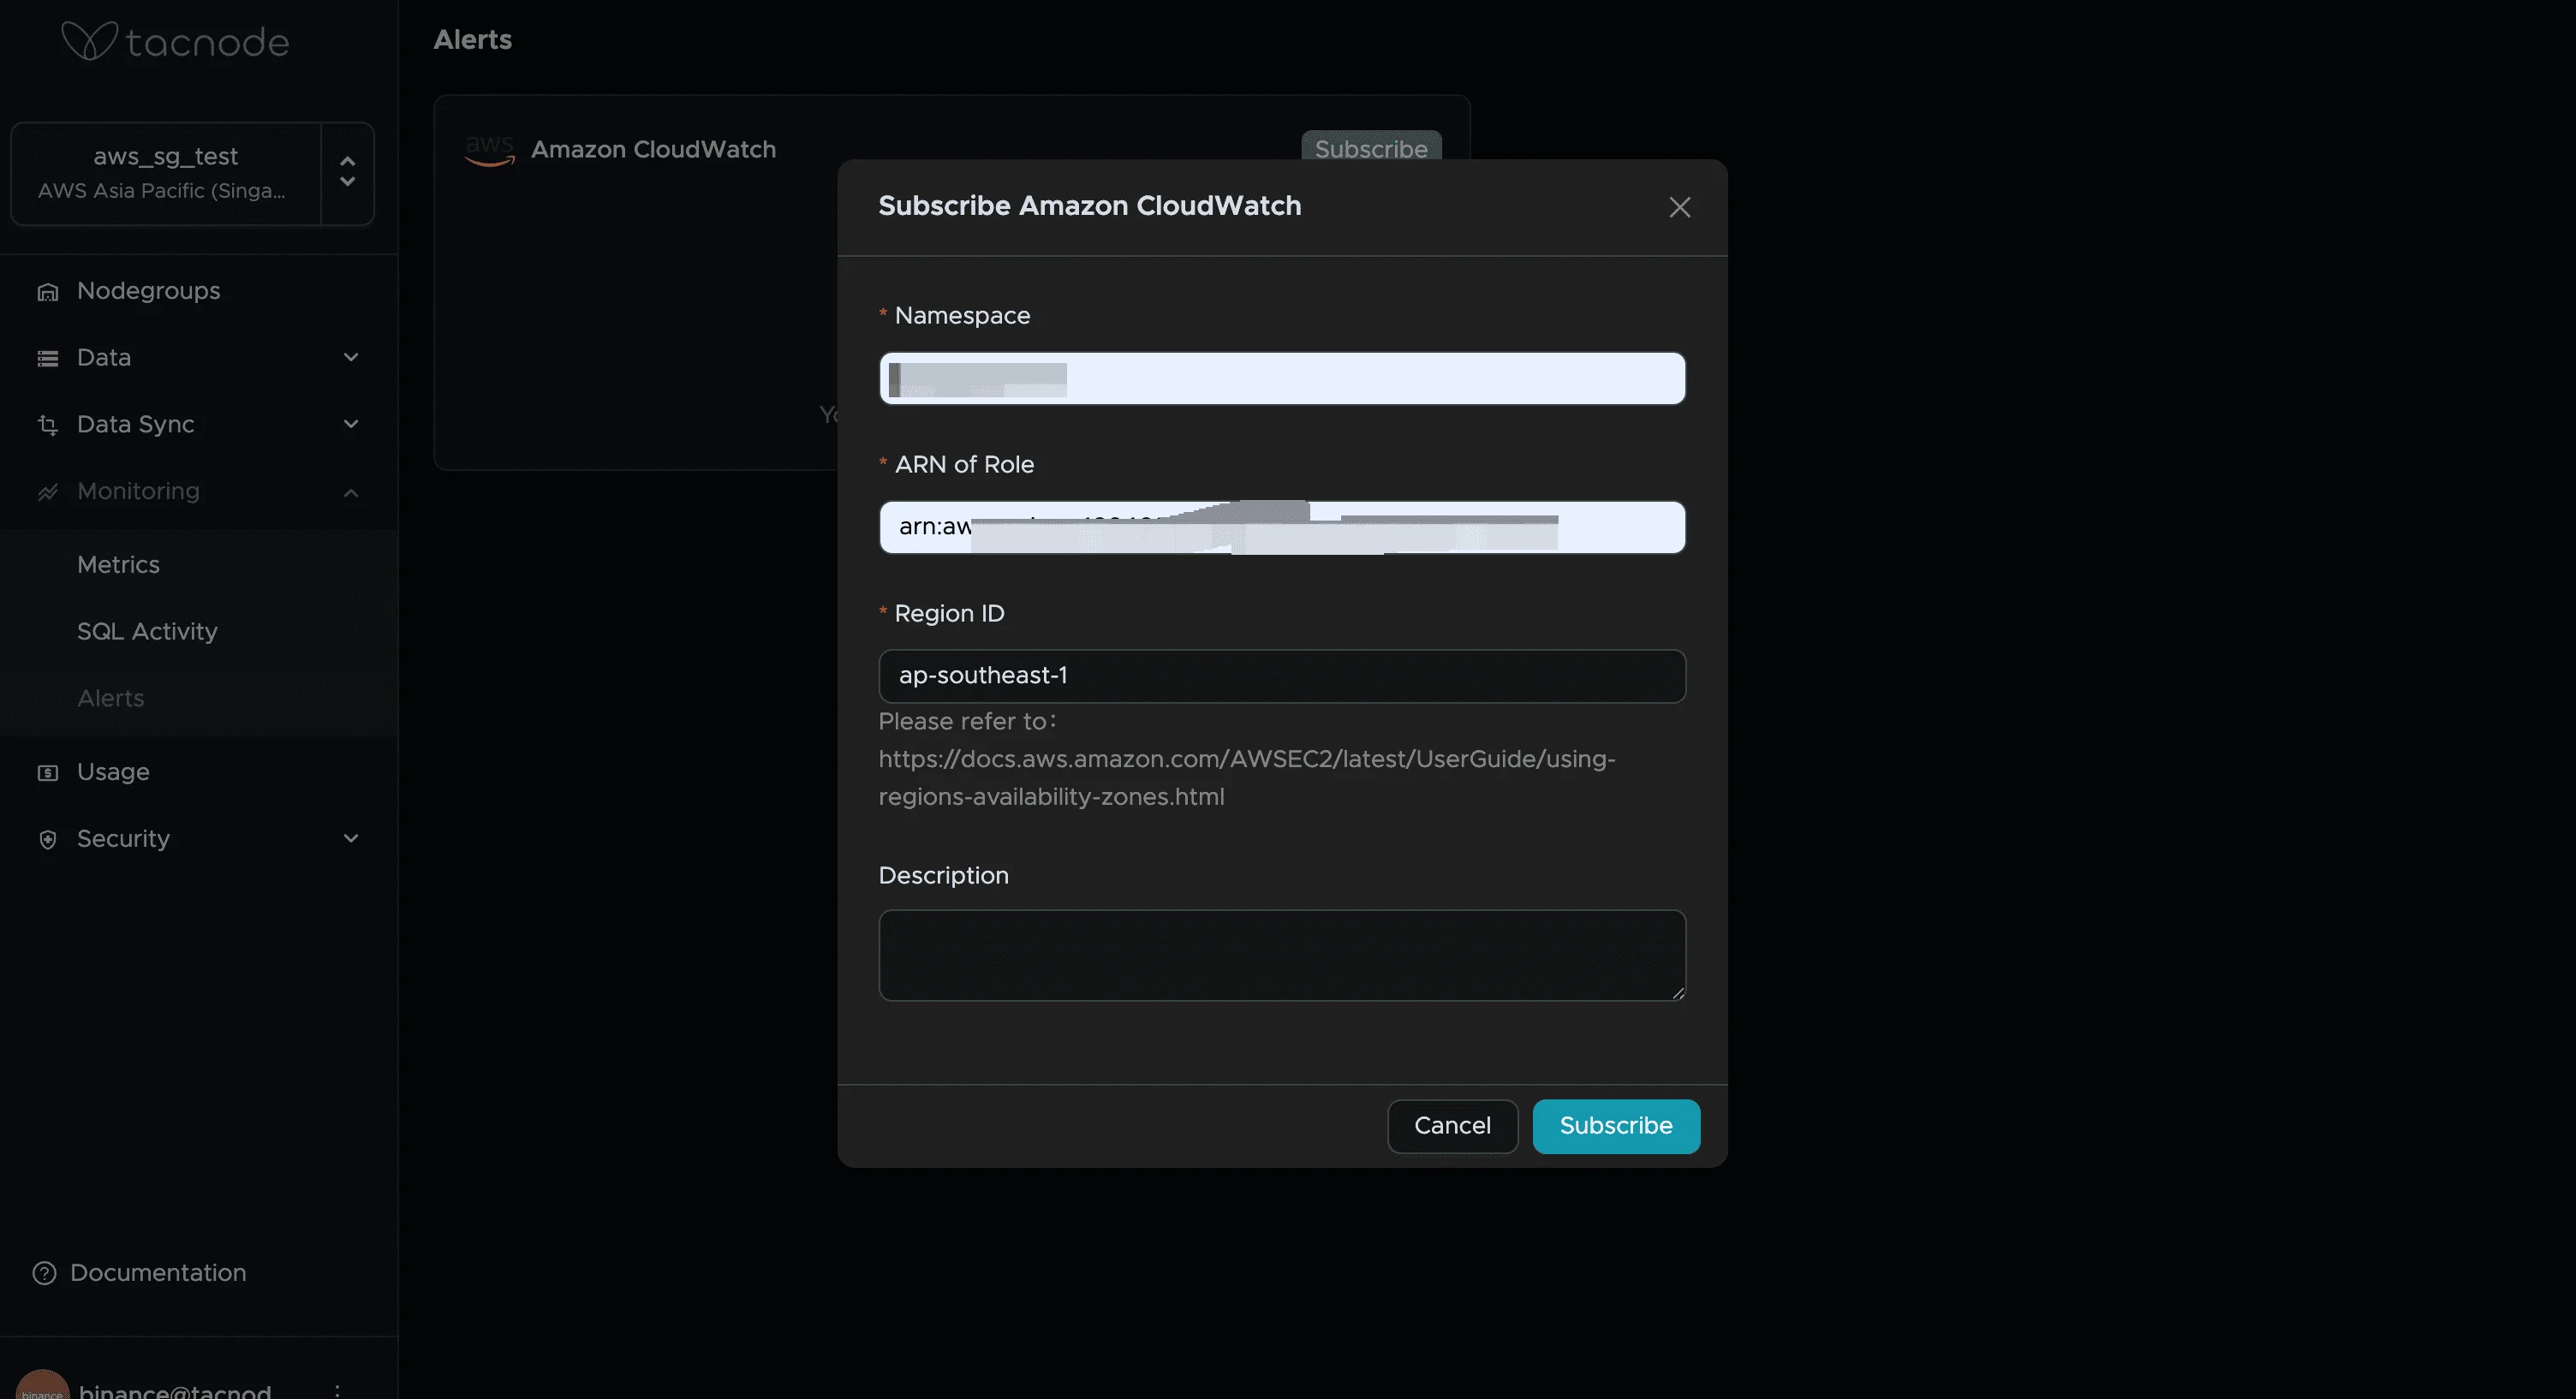
- Namespace: Custom CloudWatch namespace (e.g.,
-
Test and Activate
- Click “Test Connection” to validate configuration
- Save settings once validation succeeds
- Enable the integration to start metric flow
Viewing Metrics in AWS Console
Accessing CloudWatch Metrics
-
Navigate to CloudWatch
- Open AWS CloudWatch Console
- Select “Metrics” from the left navigation
-
Browse Tacnode Metrics
- Look for your custom namespace (e.g.,
Tacnode/Production) - Explore available metric dimensions and names
- Create custom dashboards for operational monitoring
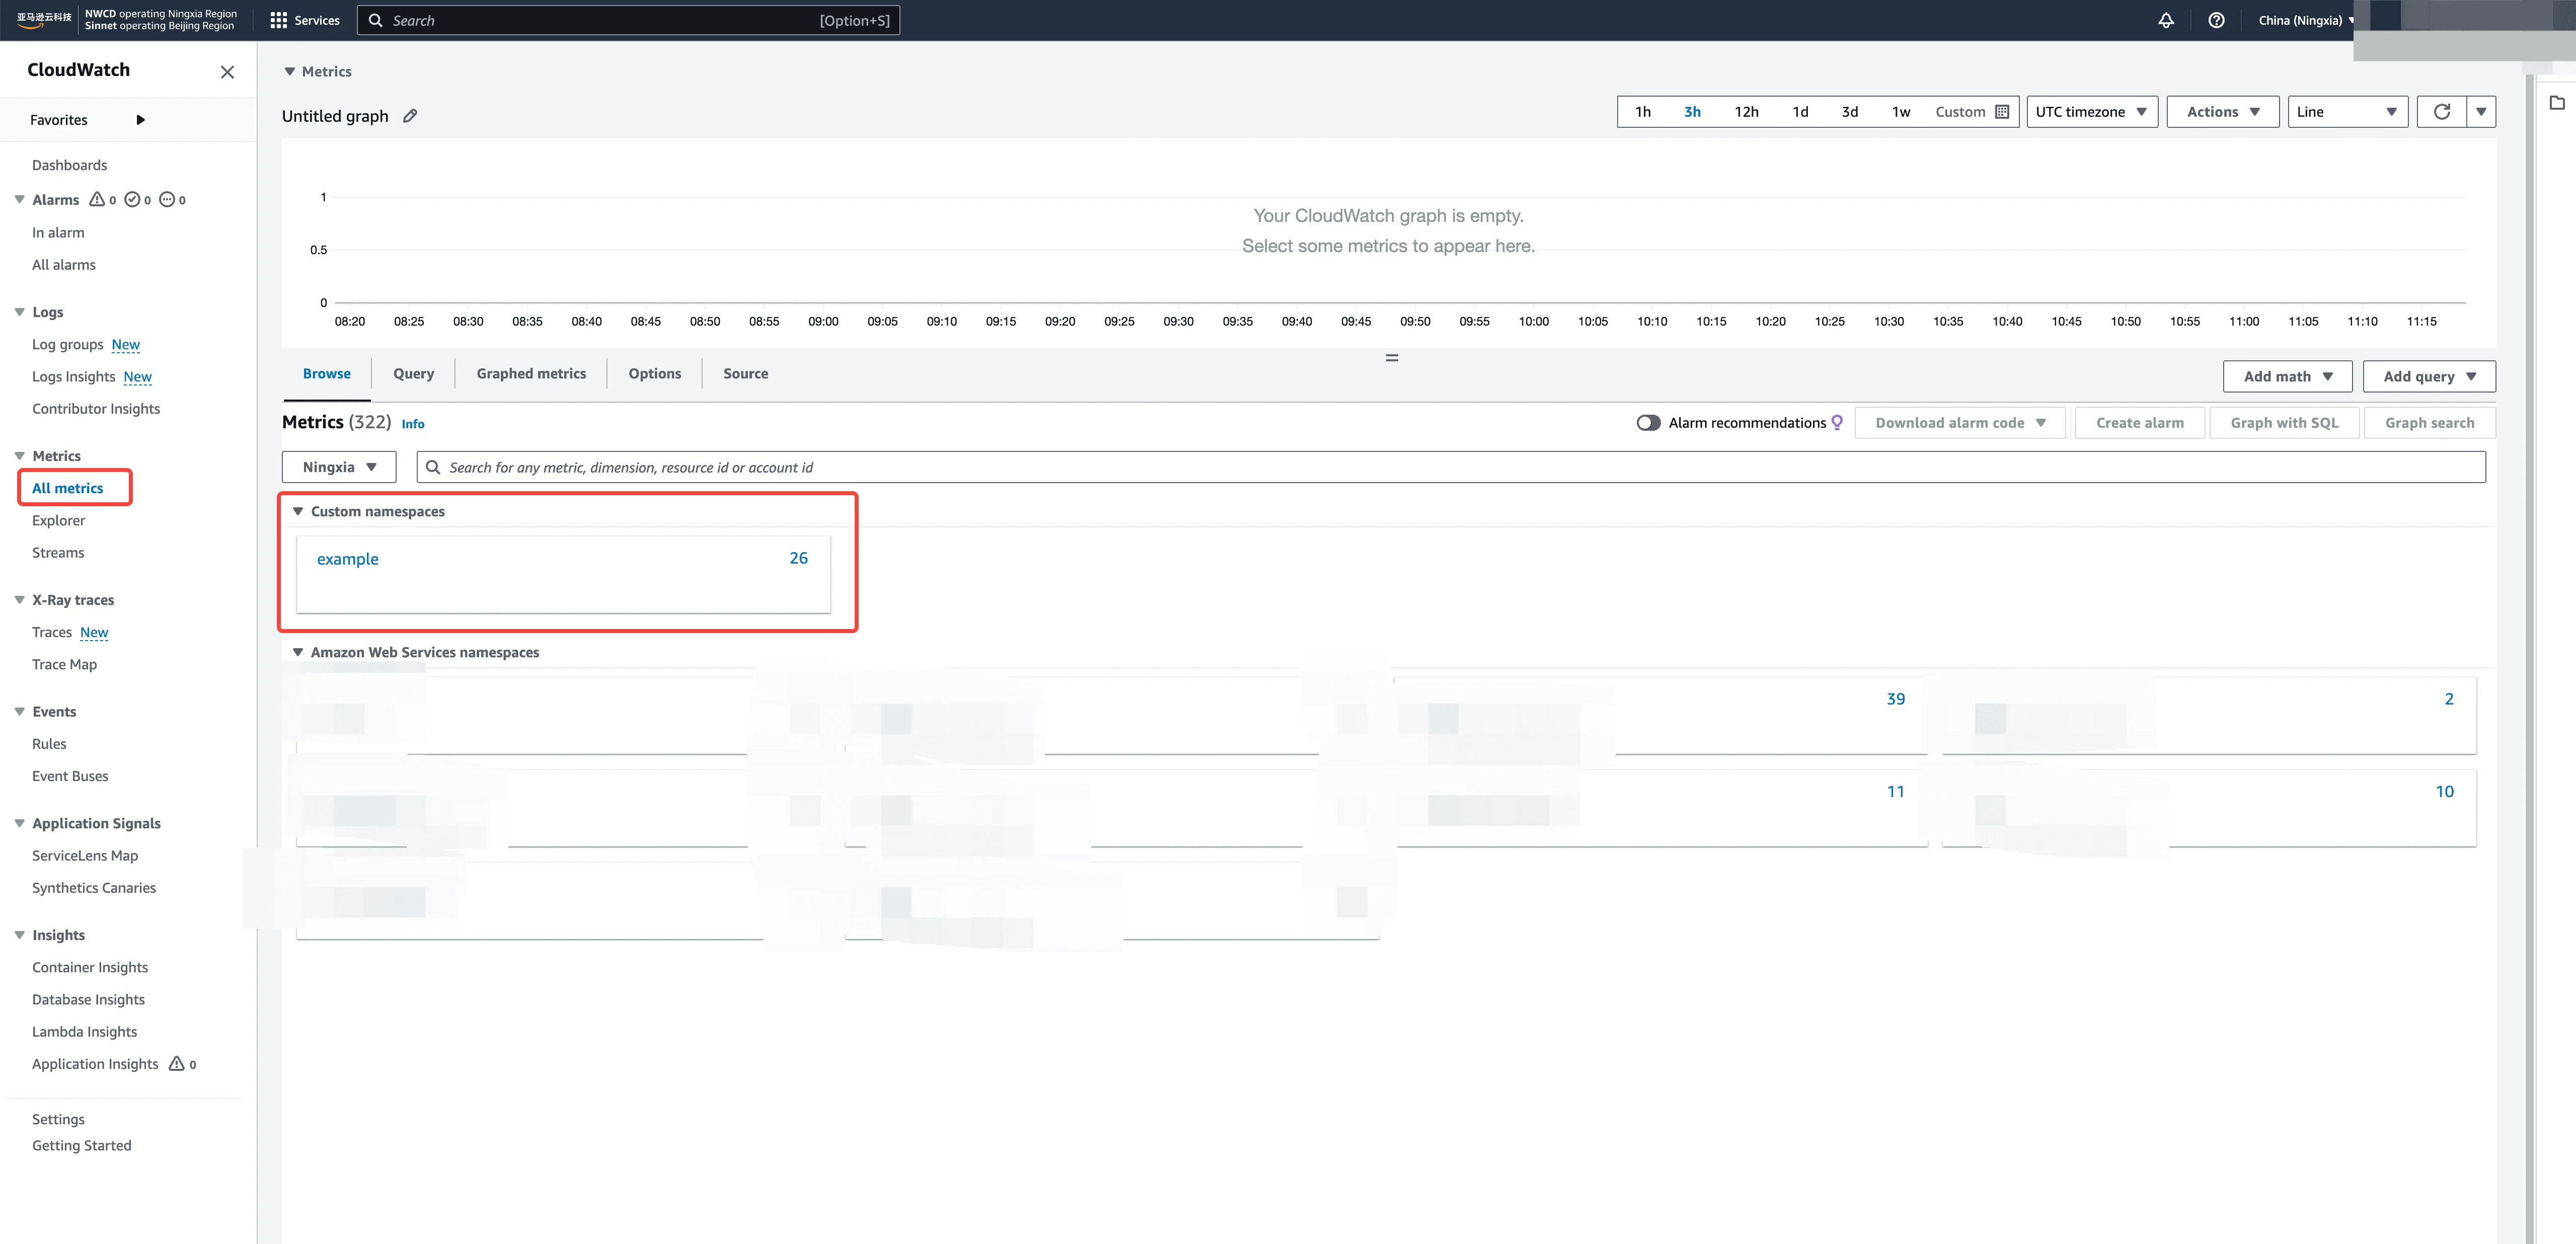
- Look for your custom namespace (e.g.,
Available Metric Categories
Nodegroup Metrics:
- Resource utilization (CPU, memory)
- Query performance (QPS, latency)
- Network throughput
- Connection counts
Database Metrics:
- Storage usage and growth
- Transaction rates
- Backup metrics
System Health Metrics:
- Error rates and failed queries
- Resource contention indicators
- Performance degradation signals
Setting Up CloudWatch Alarms
Creating Effective Alerts
-
Performance Alerts
- High CPU utilization (>80% for 5 minutes)
- High memory usage (>85% for 3 minutes)
- Query latency spikes (P99 > threshold)
-
Availability Alerts
- Failed query rate increases
- Connection pool exhaustion
- Nodegroup unavailability
-
Capacity Alerts
- Storage growth rate acceleration
- Approaching resource limits
- Scaling threshold breaches
Best Practices for Alerting
Threshold Selection:
- Use historical data to set realistic thresholds
- Account for normal operational variance
- Implement hysteresis to prevent alert flapping
Notification Routing:
- Critical alerts to on-call rotation
- Warning alerts to team channels
- Informational alerts to operational dashboards
Escalation Procedures:
- Define clear escalation paths
- Include runbook links in alert descriptions
- Set up automated response for common scenarios
Troubleshooting Integration Issues
Common Problems and Solutions
Role Assumption Failures:
- Verify IAM role trust policy includes correct account ID
- Check role permissions include all required CloudWatch actions
- Ensure role ARN is correctly formatted in Tacnode configuration
Metric Publishing Failures:
- Validate AWS region configuration
- Check CloudWatch service limits and quotas
- Verify namespace naming follows AWS conventions
Missing Metrics:
- Confirm integration is enabled and active
- Check for error logs in Tacnode console
- Validate metric names and dimensions
Getting Support
For integration issues that persist after troubleshooting:
- Collect CloudWatch integration logs from Tacnode
- Document IAM role and policy configurations
- Note specific error messages and timestamps
- Contact Tacnode support with AWS account and region details
Cost Optimization
Managing CloudWatch Costs
Metric Volume Control:
- Select only essential metrics for CloudWatch export
- Use appropriate resolution settings
- Implement metric filtering for high-volume metrics
Retention Management:
- Configure appropriate retention periods for different metric types
- Use CloudWatch Logs Insights for cost-effective log analysis
- Archive historical data to S3 for long-term storage
Dashboard Optimization:
- Create focused dashboards for different audiences
- Use CloudWatch pricing calculator to estimate costs
- Monitor actual usage against budgets
This comprehensive CloudWatch integration provides enterprise-grade monitoring and alerting capabilities for your Tacnode data warehouse environment.