Semantic Layer: What It Is and Why It Breaks on Data You Write
What a semantic layer is, how dbt, Cube and AtScale build one, why it matters for AI agents, and what changes when the data under it is data your app writes.
TL;DR: A semantic layer defines metrics, dimensions, joins and access rules once, then compiles every request from a dashboard, an app or an AI agent into SQL against your data platform, so “revenue” means the same thing everywhere. It works cleanly over a warehouse that loads data from elsewhere. It gets harder when the data under it is data your own app writes: Postgres can’t serve the metrics at analytical scale, so teams add a warehouse and a sync job, and the metrics lag the app by however long the sync takes.
Ask three teams what “active customer” means and you can get three answers. Finance counts anyone billed this month. Product counts anyone who logged in. The growth dashboard counts anyone who did either in the last 30 days. Each number is correct by its own SQL, and none of them match.
A semantic layer is the standard fix: write the definition once, and make every tool ask for the metric by name instead of rewriting the query. The idea is more than thirty years old, and it has found a second life because AI agents now ask data questions too, and they guess at join paths even more freely than analysts do.
Most writing on semantic layers assumes the data sits in a warehouse, loaded from SaaS tools and source databases. This page covers that case, then the one it skips: a team whose own application writes the data the metrics are built on, and whose users or agents need those metrics while the data is still changing.
What Is a Semantic Layer?
A semantic layer is a governed set of definitions (metrics, dimensions, entities, join paths and access rules) that sits between stored data and the tools that query it. Consumers ask for a metric by name, and the semantic layer generates the SQL, so every dashboard, app and AI agent gets the same number from the same definition.
The idea predates the cloud warehouse. A patent filed in 1991 and assigned to Business Objects, granted in 1996 as US 5,555,403, describes a system that lets end users “access (query) relational databases without knowing the relational structure or the structure query language (SQL).” Its “universe” of business objects, with joins generated automatically, is an early ancestor of today’s semantic layers.
What has changed is where the layer lives. It used to sit inside one BI tool. Now it is often a separate service that many tools, applications and agents query, sometimes called a headless or universal semantic layer. The term “metrics layer” usually means the same thing, with the emphasis on metric definitions.
The Parts of a Semantic Layer
Every implementation names these differently, but the pieces are consistent.
Entities are the things you count and the keys that connect them: customer, order, account. They define legal join paths.
Dimensions are how you slice: region, plan, signup cohort, time grain.
Measures and metrics are the numbers. A measure is an aggregation over a column. A metric can combine measures into ratios, cumulative windows or conversion rates.
Access rules decide who sees which rows and columns.
Caching or pre-aggregation stores common results so the warehouse doesn’t recompute them on every request.
If a customers semantic model defines a region dimension, a request for order_total by customer__region by day compiles to roughly this:
sql
SELECT date_trunc('day', o.ordered_at) AS metric_time__day,
       c.region                         AS customer__region,
       SUM(o.order_total)               AS order_total
FROM   orders o
LEFT JOIN customers c ON o.customer_id = c.customer_id
GROUP  BY 1, 2;
The value is not the SQL, which anyone can write. It is that nobody writes it twice. The join is derived from entity types, so a dashboard and an agent can’t pick different paths.
How Semantic Layers Are Built
Semantic layers differ mostly in where the definitions live and where the compute runs.
dbt Semantic Layer. Powered by MetricFlow, which dbt describes as “a SQL query generation tool.” dbt’s documentation says the Semantic Layer lets teams define metrics on top of existing models while “automatically handling data joins,” and lists result caching and declarative caching for performance. MetricFlow is licensed Apache 2.0, per its documentation.
Cube.Cube’s documentation describes a semantic layer, built on open-source Cube Core, that “centralizes metric definitions, joins, access rules, and caching upstream of every BI tool, application, and AI agent.” Models are built from cubes and views. Pre-aggregations are rollup tables declared in the model and refreshed in the background into Cube Store. It exposes Postgres-compatible SQL, REST and GraphQL APIs.
AtScale.AtScale’s product page says it “queries data where it sits and doesn’t copy it out of your warehouse,” “keeps the aggregates it builds so repeat questions cost less,” works with BI tools such as Power BI, Tableau and Excel, and offers Model Context Protocol access for AI systems. Its modeling language, SML, was released as open source under an Apache license in 2024.
Approach
Where definitions live
Where queries run
Examples
BI-embedded
Inside one BI tool’s model
The warehouse via that tool, or the tool’s imported copy
Classic BI “universes,” Power BI semantic models
Transformation-layer
Next to the transformation code
The data platform, via generated SQL
dbt Semantic Layer (MetricFlow)
Standalone service
A separate model and API server
The warehouse, plus the service’s own pre-aggregations
Cube, AtScale
Platform-native
In the warehouse or lakehouse catalog
The platform itself
Snowflake semantic views, Databricks metric views
Semantic Layers Built Into Data Platforms
The newest pattern puts the definitions inside the data platform, next to the tables.
Snowflake semantic views.Snowflake’s documentation describes a semantic view as “a schema-level object” in which “you can define business metrics and model business entities and their relationships.” Cortex Agents and the Cortex Analyst API can query them.
Databricks metric views.Unity Catalog metric views separate “measure definitions from the fields (also called dimensions) used to group, filter, and aggregate them, so you can define metrics once and query them at runtime.” The same documentation lists SQL editors, notebooks, dashboards, Genie Agents, alerts and external BI tools as consumers.
Power BI semantic models. A Power BI semantic model is the model reports query. Microsoft’s documentation notes that models in Import mode “need refresh to keep data current,” while DirectQuery models send queries to the source “to retrieve current data.” Most semantic layers make the same trade: serve a stored copy, or query the source at request time.
A shared format. Definitions written for one tool don’t move to another. In September 2025, Snowflake and partners launched the Open Semantic Interchange to build “a common, vendor-agnostic semantic model specification.” The project entered the Apache Incubator in June 2026 and was renamed Apache Ossie.
All of these share one assumption: the system of record for analytics is a warehouse or lakehouse, and the semantic layer reads it.
Semantic Layers for AI and LLMs
Text-to-SQL is where the semantic layer has found new urgency. A model given only a schema has to guess which table holds revenue, whether refunds are netted out and which join is safe. It guesses wrong often enough to matter.
A 2026 paired benchmark tested three frontier models on 100 natural-language questions over a retail dataset. With only the schema, accuracy ranged from 45.5% to 50.5%. With about 4 KB of semantic documentation describing measures, conventions and disambiguation rules, it rose to 67.7% to 68.7%. Within each condition the three models were statistically indistinguishable; the document, not the choice of model, accounted for essentially all of the significant variance. The authors interpret this as explicit semantics suppressing the dominant class of text-to-SQL errors “not by making the model more capable, but by changing what the model is being asked to do.”
That is the case for putting agents behind a semantic layer: they request order_total by region, and the layer decides the SQL. Several vendors now expose their models to agents directly, through SQL interfaces or MCP servers. For more on what agents need underneath analytics, see the agentic analytics data layer.
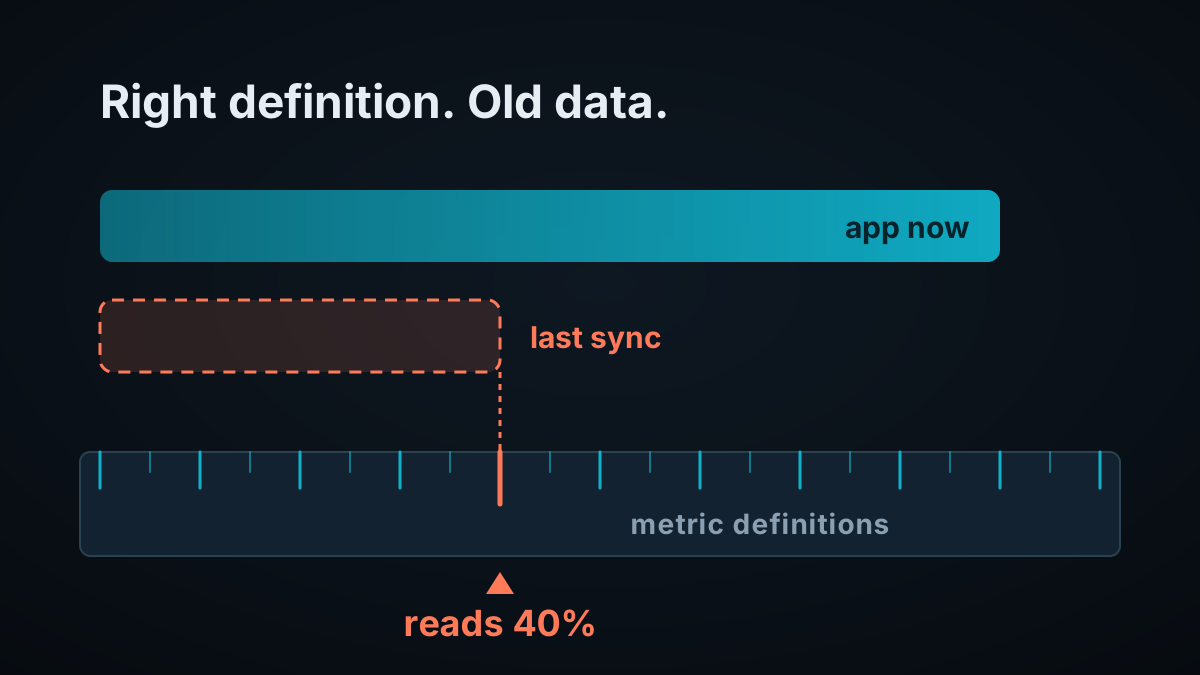
A semantic layer fixes meaning. It doesn’t fix timing. An agent that asks for “available credit” gets the governed definition, computed over whatever data the warehouse holds at that moment. If the warehouse is an hour behind the app, the agent gets a governed, consistent, hour-old number. For a weekly business review, that’s fine. For an agent deciding whether to approve a draw, it isn’t.
Where It Breaks: Data You Also Write
The warehouse assumption holds when the warehouse is downstream of everything: billing exports, CRM syncs, ad platforms. It strains when the data under the metrics is data your own application writes, and the metrics feed back into the product: positions and orders on a trading app, balances and draws at a lender, labels and outputs that your agents write and then read.
Postgres holds that data, because the app needs transactions. But Postgres is a row store built for the app’s reads and writes. Ask it for metrics over the full history at analytical scale and those queries compete with the app for the same machine. The usual escape is a materialized view, and PostgreSQL’s documentation is clear about what refresh does: it “completely replaces the contents of a materialized view.” The CONCURRENTLY option avoids locking out concurrent selects, but each refresh still executes the view’s full backing query.
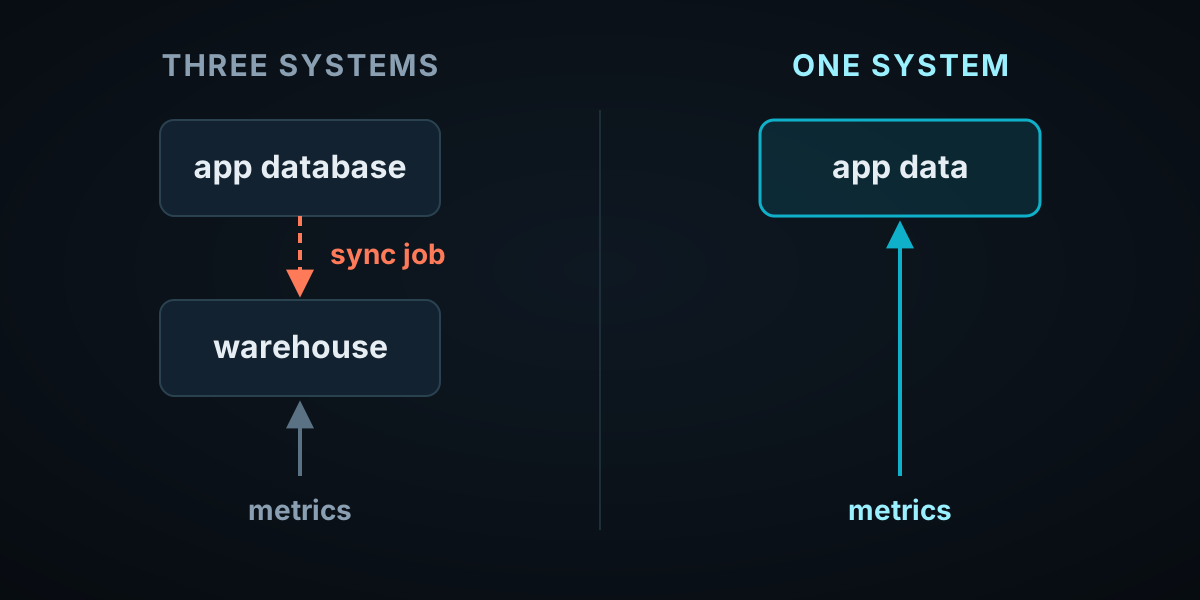
So the default architecture becomes three systems: Postgres for the app, a warehouse for the metrics, and a sync job (often change data capture) between them. The semantic layer sits on the warehouse. That is a composed stack on day one, with the modern data stack’s coherence problem built in.
A worked timeline (illustrative). A small lending app syncs Postgres to its warehouse every 15 minutes. “Utilization” is a governed metric over the warehouse: drawn balance divided by limit, per borrower.
Every definition was correct. The metric was correct for 10:00. The agent acted at 10:04. Shorten the sync and the window shrinks; it never closes, because the metric lives in a different system from the write.
For a team of one to five data engineers, the bigger cost is often not the lag but the stack: one person builds the sync, runs the warehouse, maintains the semantic models and debugs every time the two disagree.
Time
Event
App database
Metric via semantic layer
10:00:00
Sync completes
Drawn $2,000 of $5,000
40% utilization
10:03:10
Borrower draws $2,500
Drawn $4,500
40%
10:04:00
Support agent asks “can this borrower draw another $1,500?”
Drawn $4,500
40%: answers yes
10:15:00
Next sync
Drawn $4,500
90%
Your Options When the App Writes the Data
Query Postgres directly. At small scale this is the right answer. A semantic layer tool that connects to Postgres generates the SQL; the app’s database runs it. It stops working when metric queries start hurting the app’s latency or full-refresh views take too long.
Add a read replica. This moves the load off the primary, and the replica can fall behind at peak. Analytical queries over large history are still running on a row store.
Postgres, warehouse and sync. The standard composed stack. Metrics run at analytical scale, at the cost of a second system, a pipeline and a lag equal to the sync interval.
One system for both. Store the app’s data in a system that handles transactional writes and analytical reads, and define the metrics where the data is written. No sync job, no second copy to drift.
Which is right depends on scale and on how much the metric’s age matters. If nothing reads the metrics within minutes of a write, the composed stack is a reasonable trade.
Where Tacnode Fits
Tacnode is not a semantic layer product. It doesn’t replace your metric definitions or the tool that manages them. It addresses the stack underneath them when the data is data you write.
The Tacnode Context Lake™ is context infrastructure that presents the PostgreSQL wire protocol, so the app writes to it the way it writes to Postgres, and tools that connect to Postgres connect the same way. Its hybrid storage serves the app’s row reads and the analytical scans behind a metric from the same data. Most metric queries run on demand against the latest committed data, so the number reflects the last write, not the last sync. Expensive aggregates can be incremental materialized views, refreshed incrementally on a schedule you set in SQL, typically every few seconds, where each refresh applies only what changed. Tables export to Iceberg, so a warehouse can keep reading them for reporting.
For a small team, that is one system instead of three: the app’s writes, the metrics, the documents your agents search and what the agents write back, in one place. For a team that expects freshness and read volume to matter later, it means not migrating twice. The derived context your metrics represent is computed against the same state the app just wrote.
The choice is easiest when the stack is being chosen: a greenfield build, a first data engineer’s first project, or a store that just failed. A team that already runs Postgres, a warehouse and a sync job, and isn’t feeling the lag, has little reason to move.